


Introduction to SQL for Data Analytics Beginners
Learn SQL for Data Analytics with real examples, essential commands, joins, and practice resources. A beginner-friendly guide by Neody IT.
Introduction to SQL for Data Analytics: A Beginner Friendly Guide by Neody IT
If you are trying to become a Data Analyst but still ignoring SQL, then honestly, you are just delaying your own progress. You can learn Python, watch tutorials, save reels, but when it comes to handling real data, SQL is the skill that actually gets the job done.
People learn fancy tools, but when asked to extract data from a database, everything goes blank. Let’s fix that today.
This guide will help you understand SQL from a practical Data Analytics perspective, not in a boring textbook way, but in a way that actually makes sense.
What is SQL?
SQL stands for Structured Query Language. It is used to communicate with databases.
In simple terms, SQL is the language you use to talk to data.
You want data. SQL gives it to you.
You want to filter, sort, or analyze data. SQL does it.
Basic Concepts You Must Understand
Before writing queries, you need to understand a few basic things.
What is a database?
A database is a collection of organized data. Think of it like your phone gallery, but instead of photos, it stores structured information.
What is a table?
A table is where data is stored inside a database. It looks like an Excel sheet with rows and columns.
Rows vs Columns
Rows represent individual records. Columns represent attributes of those records.
For example, in a students table:
| ID | Name | Marks |
|---|---|---|
| 1 | Rahul | 85 |
| 2 | Priya | 92 |
Each row is a student. Each column is a detail about that student.
Real Life Example
Imagine Netflix. It stores data like:
-
Users
-
Movies
-
Watch history
SQL helps Netflix answer questions like:
-
Which shows are trending
-
What should be recommended next
-
Which users are most active
Why SQL is Important for Data Analysts
Let’s be real. If you are aiming to become a Data Analyst and don’t know SQL, you are basically showing up to a cricket match without a bat.
Why it matters
-
Data Analysts work with large datasets
-
SQL helps extract useful data quickly
-
Almost every company uses SQL
-
It is one of the most asked skills in interviews
Business Use Cases
-
Find total sales this month
-
Identify top performing products
-
Analyze user behavior
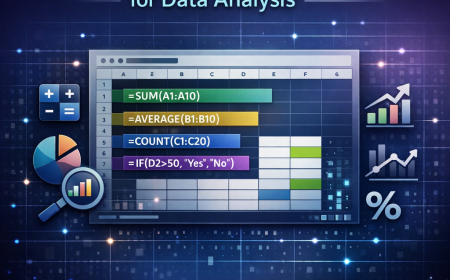
SQL vs Excel
Excel is great, but only up to a limit.
Once your data becomes large, Excel starts lagging like your phone after installing too many apps.
SQL, on the other hand, is built for handling large data efficiently.
Real World Example
Let’s say your manager asks:
-
Find top 10 customers based on purchase
-
Calculate monthly revenue
If you try this in Excel with huge data, good luck.
With SQL, it’s just a few lines.
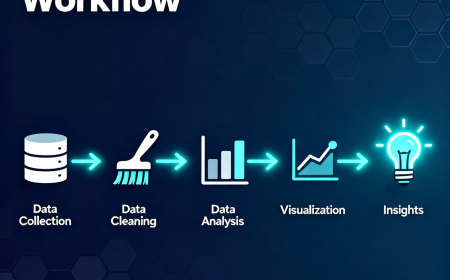
How SQL Works
The flow is simple:
Database → Tables → Query → Result
-
Data is stored in tables
-
You write a query
-
SQL processes it
-
You get results
Think of it like ordering food.
You tell SQL what you want. SQL brings exactly that. No extra drama.
Types of SQL Commands
SQL commands are divided into categories.
DDL Commands
Used to define structure.
-
CREATE creates a table
-
ALTER modifies a table
-
DROP deletes a table
DML Commands
Used to manipulate data.
-
INSERT adds data
-
UPDATE modifies data
-
DELETE removes data
DQL Commands
-
SELECT is used to retrieve data
DCL Commands
-
GRANT gives access
-
REVOKE removes access
For Data Analytics, your main focus will be on SELECT and data manipulation.
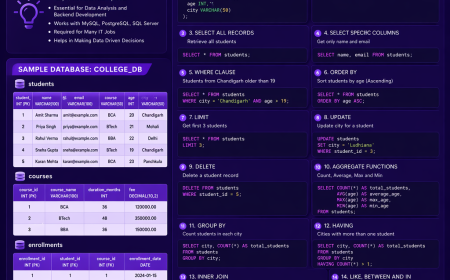
Most Important SQL Commands for Data Analytics
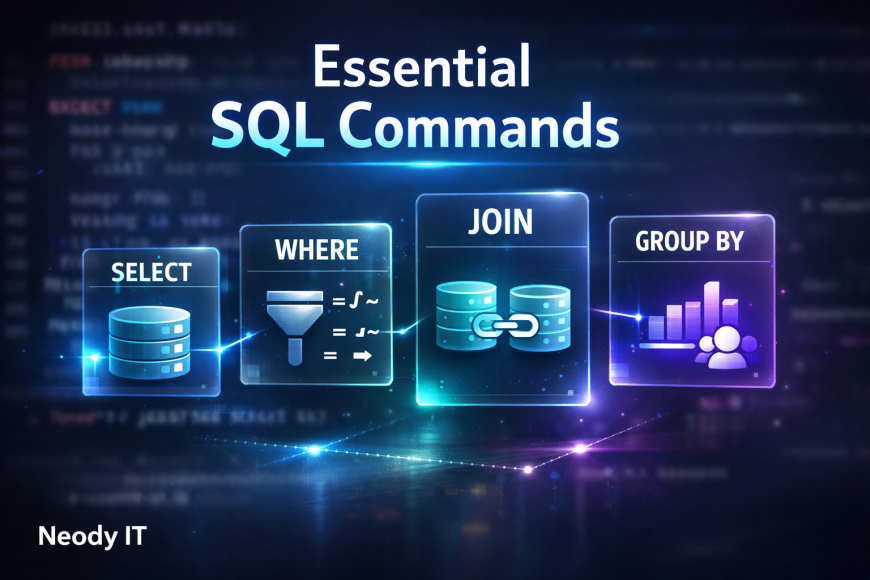
This is where things get serious. These commands are used daily by Data Analysts.
SELECT
Used to fetch data.
Example:
SELECT name, marks FROM students;
This returns specific columns.
To get all data:
SELECT * FROM students;
WHERE
Used for filtering.
SELECT * FROM students WHERE marks > 80;
This filters students with marks greater than 80.
ORDER BY
Used for sorting.
SELECT * FROM students ORDER BY marks DESC;
This shows highest marks first.
LIMIT
Used to restrict results.
SELECT * FROM students LIMIT 5;
Only returns first 5 rows.
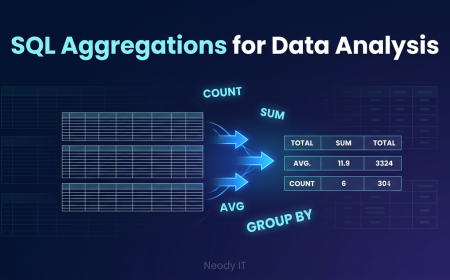
GROUP BY
Used to group data.
SELECT department, COUNT(*) FROM employees GROUP BY department;
This counts employees in each department.
HAVING
Used to filter grouped data.
SELECT department, COUNT(*)
FROM employees
GROUP BY department
HAVING COUNT(*) > 5;
DISTINCT
Removes duplicate values.
SELECT DISTINCT city FROM customers;
Aggregate Functions
These are used for calculations.
-
COUNT gives total records
-
SUM gives total value
-
AVG gives average
-
MAX gives highest value
-
MIN gives lowest value
Example:
SELECT AVG(marks) FROM students;
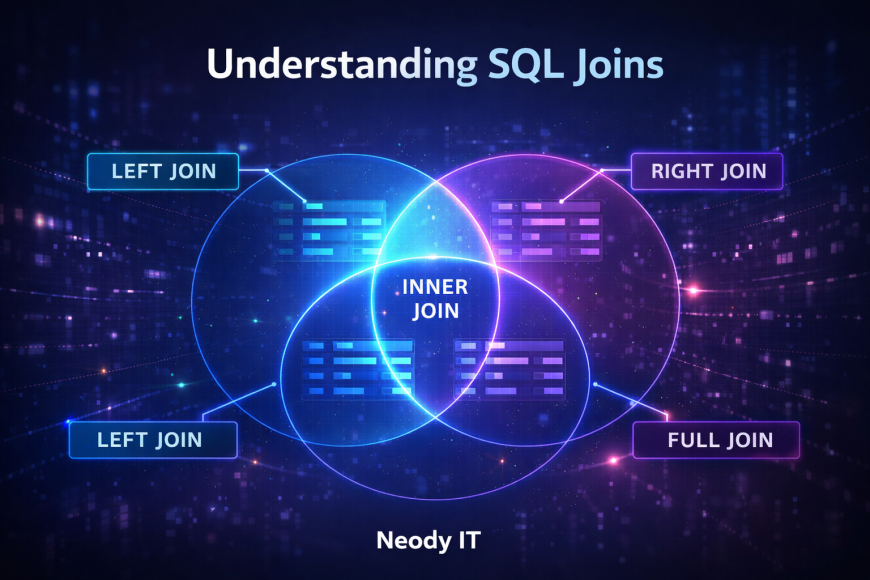
SQL Joins: The Core Skill
If you don’t understand joins, you are not doing real Data Analytics yet.
Why Joins Are Needed
Data is often split across multiple tables.
Example:
-
Users table
-
Orders table
To analyze user purchases, you need to combine them.
Types of Joins
INNER JOIN
Returns matching records.
SELECT users.name, orders.amount
FROM users
INNER JOIN orders ON users.id = orders.user_id;
LEFT JOIN
Returns all users, even if they have no orders.
RIGHT JOIN
Returns all orders, even if user data is missing.
FULL JOIN
Returns everything from both tables.
Real Life Example
Imagine checking your crush’s Instagram activity and your own messages.
You need both datasets to understand what’s really going on.
That’s what joins do. Combine data to reveal truth.
Subqueries
A query inside another query.
Used for complex filtering.
Example:
SELECT name FROM students
WHERE marks > (SELECT AVG(marks) FROM students);
This finds students scoring above average.
SQL for Real Data Analysis

This is where SQL becomes powerful.
Use Cases
-
Find top selling products
-
Calculate monthly revenue
-
Analyze user activity
-
Segment customers
Example:
SELECT product, SUM(sales)
FROM orders
GROUP BY product
ORDER BY SUM(sales) DESC;
Popular SQL Databases
At Neody IT, we recommend starting with these:
-
MySQL which is beginner friendly
-
PostgreSQL which is powerful and widely used
-
SQLite which is lightweight
-
Microsoft SQL Server used in enterprises
-
Oracle used in large scale systems
SQL vs Python for Data Analytics
SQL and Python are not competitors. They are partners.
-
SQL is used to extract data
-
Python is used to analyze and visualize data
You use SQL to get data and Python to make sense of it.
Beginner SQL Learning Roadmap
If you are confused where to start, follow this:
-
Learn SELECT and WHERE
-
Practice filtering and sorting
-
Learn GROUP BY and aggregates
-
Master JOINs
-
Work on real datasets
Consistency matters more than speed.
Best Platforms to Practice SQL
You can use:
-
LeetCode for real interview questions
-
HackerRank for beginners
-
Mode Analytics for practical learning
-
SQLBolt for interactive tutorials
-
W3Schools for quick reference
Common Mistakes Beginners Make
Let’s be honest.
-
Not understanding table structure
-
Ignoring JOINs
-
Writing inefficient queries
-
Watching tutorials but not practicing
If you are just saving reels and not practicing, you already know the problem.
Conclusion
SQL is not optional for Data Analysts. It is essential.
Without SQL, you cannot work with real data. You cannot extract insights. You cannot solve business problems.
At Neody IT, we strongly recommend starting SQL today and practicing daily.
Because the truth is simple.
You can scroll reels all day and still feel productive.
Or you can write one SQL query and actually become better.
Your choice.
If you want more practical guides, real world projects, and step by step learning, keep following Neody IT.
What's Your Reaction?
 Like
4
Like
4
 Dislike
0
Dislike
0
 Love
5
Love
5
 Funny
0
Funny
0
 Angry
0
Angry
0
 Sad
0
Sad
0
 Wow
9
Wow
9