


Exploratory Data Analysis EDA Beginner Guide
Learn Exploratory Data Analysis (EDA) with this beginner guide. Discover patterns, detect outliers, and identify trends using practical techniques by Neody IT.
Exploratory Data Analysis (EDA): Beginner Guide for Data Analysts
Introduction: Why Exploratory Data Analysis Matters
When you first open a dataset, it might look clean and structured. Rows and columns are neatly arranged, and everything seems ready for analysis. But in reality, raw data is rarely as simple as it appears.
Before building dashboards or applying machine learning models, data analysts must first understand the data they are working with. This is where Exploratory Data Analysis, commonly known as EDA, becomes essential.
EDA is the process of exploring data before making decisions. It helps uncover hidden patterns, detect errors, and reveal insights that are not immediately visible.
For example, a dataset may appear normal at first glance, but EDA can reveal missing values, duplicate records, or unexpected spikes in data. Without this step, any analysis built on top of the data can lead to misleading conclusions.
At Neody IT, we emphasize that EDA is not optional. It is the foundation of every successful data analysis project.
What is Exploratory Data Analysis (EDA)
Simple Definition
Exploratory Data Analysis is the process of analyzing datasets to summarize their main characteristics using statistical methods and visualizations.
Why EDA is Important
EDA plays a critical role in data analysis because it:
-
Helps understand the structure of data
-
Detects errors and inconsistencies
-
Identifies patterns and relationships
-
Improves decision making
Without EDA, analysts risk making assumptions based on incomplete or incorrect data. This can lead to flawed insights and poor business decisions.
Goals of Exploratory Data Analysis
The main goal of EDA is to understand the dataset deeply before applying advanced techniques.
Key objectives include:
-
Understanding data distribution
-
Identifying patterns and trends
-
Detecting outliers
-
Checking data quality
-
Discovering relationships between variables
By achieving these goals, analysts can ensure that their analysis is accurate and meaningful.
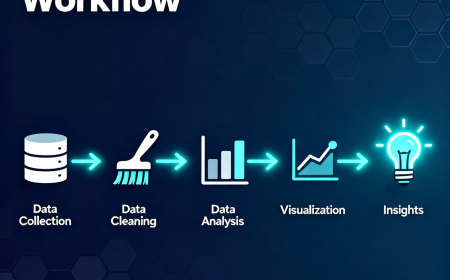
EDA Workflow: Step by Step Guide
EDA is not random exploration. It follows a structured workflow that helps analysts move from raw data to insights.
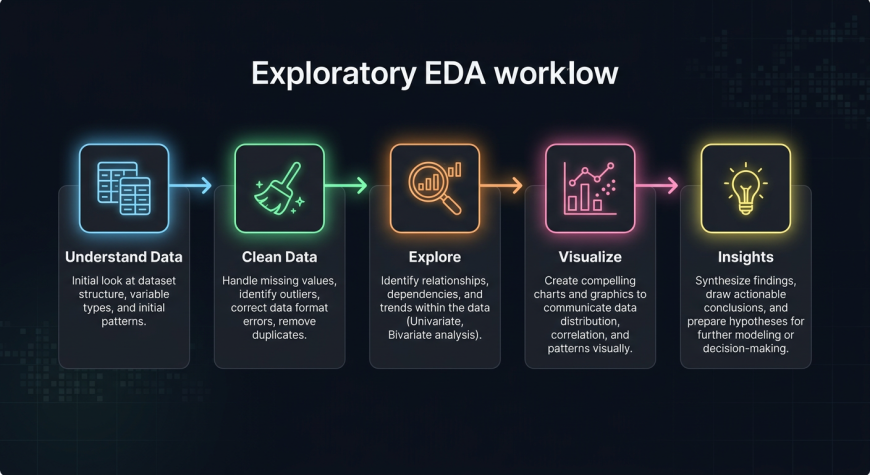
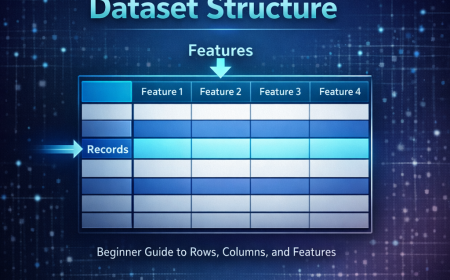
Step 1: Understand the Dataset
Start by examining the basic structure of the data:
-
Number of rows and columns
-
Data types of each column
-
Meaning of each feature
This step helps you understand what kind of data you are working with.
Step 2: Data Cleaning Overview
Before analysis, data must be cleaned.
This includes:
-
Handling missing values
-
Removing duplicate records
-
Fixing incorrect or inconsistent data
Clean data ensures reliable analysis.
Step 3: Data Exploration
This is the core of EDA.
You explore the dataset using:
-
Summary statistics
-
Distribution analysis
-
Relationship analysis
This step helps uncover hidden insights.
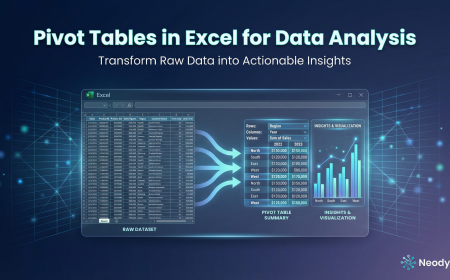
Step 4: Visualization
Visualizations make patterns easier to understand.
Common charts used in EDA include:
-
Histograms
-
Bar charts
-
Line charts
-
Box plots
Visualization transforms raw numbers into meaningful insights.
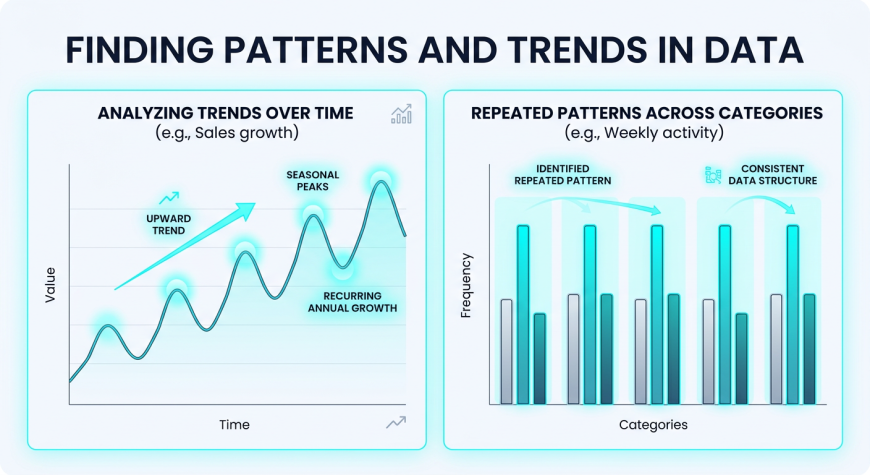
Finding Patterns in Data
What Are Patterns
Patterns are repeated behaviors or trends in data.
Examples
-
Sales increase during festive seasons
-
Website traffic is higher on weekends
Why Patterns Matter
Patterns help businesses:
-
Predict future outcomes
-
Make informed decisions
-
Understand customer behavior
Recognizing patterns is one of the most valuable outcomes of EDA.
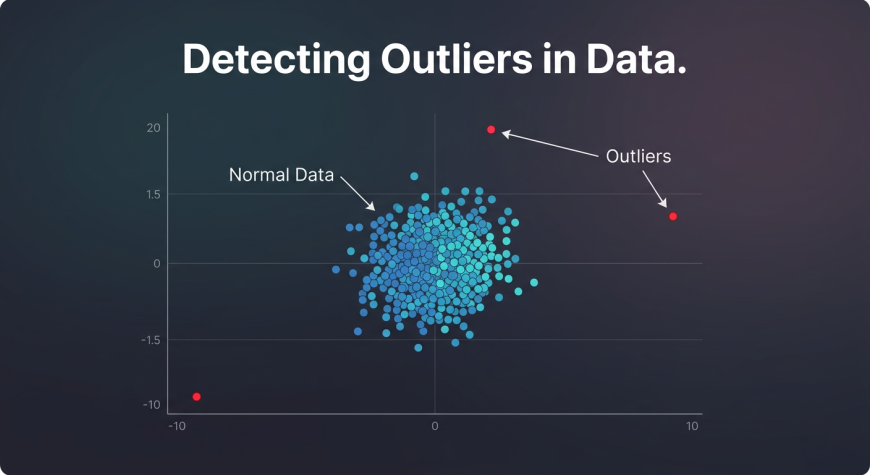
Detecting Outliers
What Are Outliers
Outliers are data points that are significantly different from the rest of the dataset.
Examples
-
A single transaction with extremely high sales
-
Negative values in fields where they should not exist
Why Outliers Matter
Outliers can:
-
Distort analysis results
-
Indicate data errors
-
Highlight special cases
How to Detect Outliers
Outliers can be identified using:
-
Box plots
-
Scatter plots
-
Statistical methods
Detecting outliers ensures that analysis remains accurate.
Identifying Trends
What Are Trends
Trends represent the direction in which data is moving over time.
Examples
-
Increasing revenue over months
-
Declining user engagement
Why Trends Matter
Trends help in:
-
Forecasting future performance
-
Planning business strategies
Understanding trends allows organizations to make proactive decisions.
Common EDA Techniques
EDA combines statistical methods with visualization techniques.
Summary Statistics
Basic statistics provide a quick overview of data:
-
Mean
-
Median
-
Mode
-
Minimum and maximum
-
Standard deviation
Data Visualization
Visual tools help understand patterns more clearly:
-
Histograms for distribution
-
Bar charts for comparison
-
Line charts for trends
-
Box plots for outliers
Correlation Analysis
Correlation helps identify relationships between variables.
For example:
-
Relationship between price and sales
-
Relationship between marketing spend and revenue
Combining statistics and visualization leads to deeper insights.
Tools Used for EDA
EDA can be performed using different tools depending on the complexity of the data.
Excel
-
Suitable for basic analysis
-
Easy to use for beginners
-
Supports simple charts
Python
-
Pandas for data manipulation
-
Matplotlib and Seaborn for visualization
Python is widely used for advanced EDA.
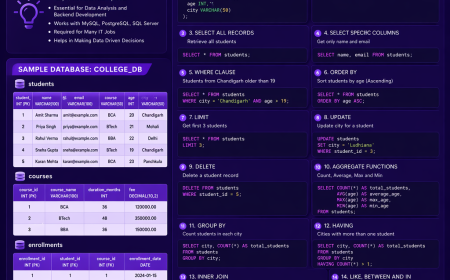
SQL
-
Used for data extraction
-
Helps perform aggregation
Most analysts use a combination of these tools in real projects.
Python EDA Workflow for Beginners
Python is one of the most popular tools for EDA.
A simple workflow includes:
-
Load dataset using Pandas
-
Check dataset structure
-
Handle missing values
-
Generate summary statistics
-
Create visualizations
This workflow allows analysts to explore large datasets efficiently.
Real World Examples of EDA
EDA is used in almost every industry.
Sales Data Analysis
-
Identify top selling products
-
Detect seasonal trends
Customer Data Analysis
-
Understand customer behavior
-
Identify high value customers
Marketing Data Analysis
-
Analyze campaign performance
-
Identify traffic patterns
EDA helps organizations make data driven decisions.
Sample Datasets for Practice
To improve EDA skills, beginners should practice with real datasets.
Popular sources include:
-
Kaggle datasets
-
Sales datasets
-
Customer datasets
Practicing with real data helps build confidence and practical skills.
Common Mistakes Beginners Make
Many beginners skip EDA or perform it incorrectly.
Common mistakes include:
-
Jumping directly to conclusions
-
Ignoring missing values
-
Not using visualizations
-
Overlooking outliers
How to Fix These Mistakes
-
Always explore data first
-
Use both statistics and charts
-
Take time to understand the dataset
Best Practices for EDA
To perform effective EDA, follow these best practices:
-
Start with simple analysis
-
Use visualizations for clarity
-
Document your findings
-
Ask questions about the data
-
Keep the process structured
Good EDA leads to accurate and meaningful insights.
Why EDA is Important for Data Analysts
EDA is the foundation of data analysis.
It helps analysts:
-
Understand data deeply
-
Improve accuracy of insights
-
Build better models
Every data project begins with EDA. Without it, analysis is incomplete.
At Neody IT, we strongly recommend mastering EDA before moving to advanced topics like machine learning or predictive analytics.
Final Takeaway
Exploratory Data Analysis transforms raw data into meaningful insights by uncovering patterns, trends, and anomalies.
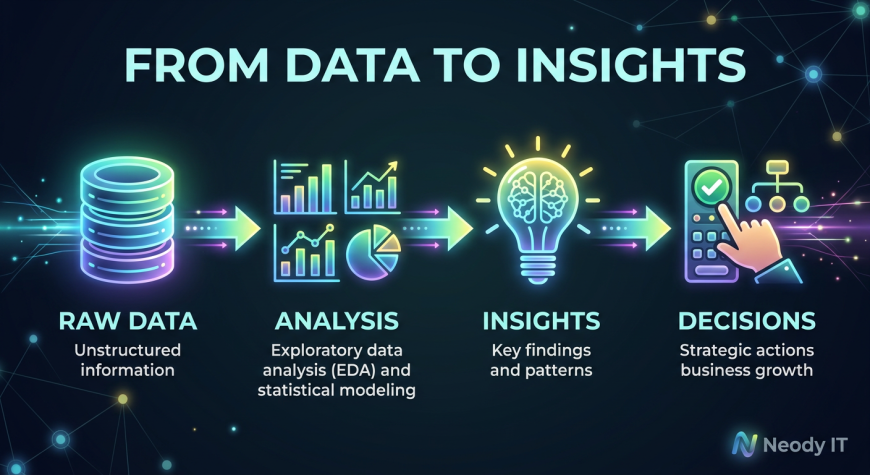
The workflow is simple:
Data → EDA → Insights → Decisions
If you want to become a strong data analyst, mastering EDA is essential. It is the step where data starts making sense.
Start practicing with real datasets, apply structured analysis, and focus on understanding your data. That is how you build a solid foundation in data analytics with Neody IT.
What's Your Reaction?
 Like
0
Like
0
 Dislike
0
Dislike
0
 Love
0
Love
0
 Funny
0
Funny
0
 Angry
0
Angry
0
 Sad
0
Sad
0
 Wow
0
Wow
0