


Data Analytics Beginner Guide: Learn Tools, Skills, Insights Fast
Learn what Data Analytics is and what a Data Analyst actually does. This beginner guide by Neody IT explains the data analytics workflow, real world examples, required skills, and career opportunities in data analysis.
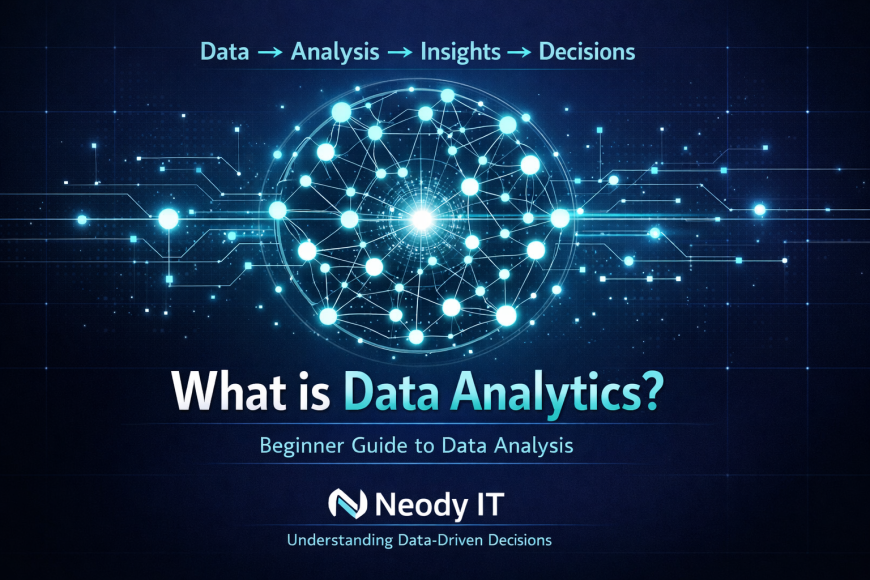

What is Data Analytics? A Complete Beginner Guide to Understanding Data Analysis
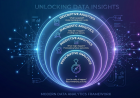
In today's digital economy, almost every organization runs on data. Businesses track customer behavior, monitor product performance, analyze marketing campaigns, and measure financial growth using data collected from multiple sources.
However, raw data alone does not provide value.
Companies may collect thousands or even millions of records every day, but without proper analysis those numbers remain meaningless. The real value appears when data is analyzed and transformed into insights that help organizations make better decisions.
This is where Data Analytics becomes important.
At Neody IT, we often explain Data Analytics as the process that turns raw numbers into knowledge that businesses can actually use. Whether a company wants to understand customer behavior, improve marketing strategies, or predict future trends, Data Analytics plays a central role.
In this beginner guide, you will learn what Data Analytics is, what a Data Analyst actually does, the analytics workflow, real world examples, required skills, and career opportunities in the field.
Why Data is the New Decision Engine
Modern companies collect enormous amounts of information from different systems. Websites track user activity, mobile applications monitor engagement, e‑commerce platforms record transactions, and businesses collect operational data every day.
But collecting data is only the first step.
Without analysis, data is simply a collection of numbers stored in databases. It does not provide answers to important questions such as:
Which product sells the most?
Which marketing campaign generates the highest revenue?
Which customer segment spends the most money?
Data Analytics helps organizations answer these questions.
For example, imagine an online store that records every purchase made on its website. The store might have thousands of transactions each month. Without analysis, the company cannot determine which products perform best or which region generates the most revenue.
By analyzing the data, the business can identify patterns, trends, and opportunities for growth. This ability to transform data into insights is the foundation of Data Analytics.
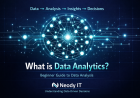
What is Data Analytics?
One Line Definition
Data Analytics is the process of examining data to discover patterns, trends, and insights that help organizations make better decisions.
Understanding the Concept in Simple Terms
To understand Data Analytics clearly, break it down into four stages.
Data represents raw information collected from different sources.
Analysis involves studying the data using statistical methods or analytical tools.
Insights are the meaningful findings extracted from the analysis.
Decisions are the actions taken based on those insights.
The overall process can be summarized as:
Data leads to Analysis
Analysis produces Insights
Insights guide Decisions
At Neody IT, we emphasize that Data Analytics is not just about numbers. It is about understanding what those numbers actually mean in a business context.
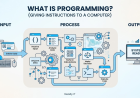
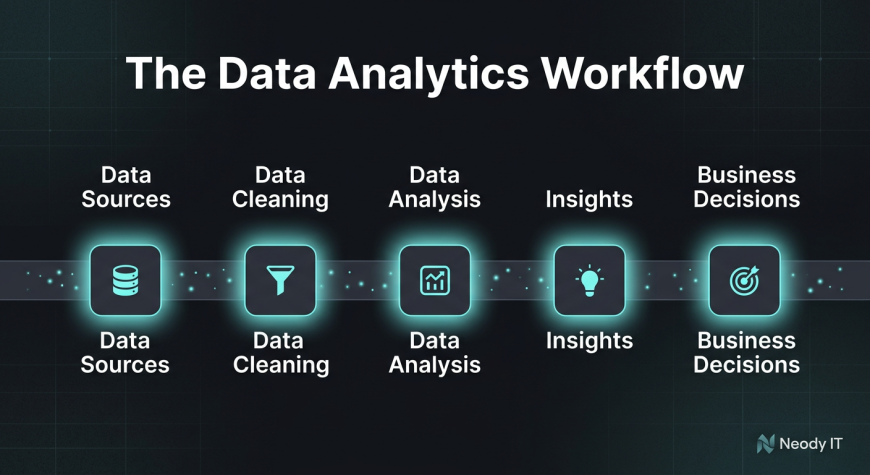
The Data Analytics Workflow
Every analytics project follows a structured workflow. Understanding this pipeline helps beginners see how data moves from raw information to useful insights.
Step 1: Data Collection
The first step is gathering data from various sources. Modern organizations collect data from multiple systems including websites, mobile applications, databases, surveys, and sensors.
For example, an online shopping platform collects information such as customer purchases, product views, payment details, and shipping locations.
This raw data becomes the foundation for analysis.
Step 2: Data Cleaning
Raw data is rarely perfect. It often contains errors or inconsistencies that must be fixed before analysis.
Common problems include missing values, duplicate entries, incorrect formatting, and incomplete records.
Data cleaning ensures the dataset is accurate and reliable. Without proper cleaning, the analysis may produce misleading results.
Step 3: Data Analysis
Once the data is prepared, analysts begin exploring it to identify patterns and relationships.
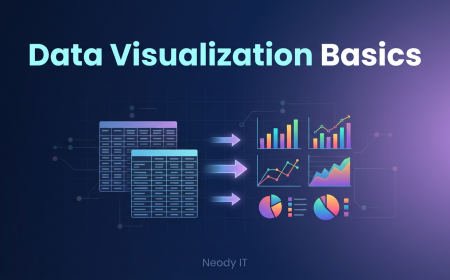
Data analysis may involve statistical calculations, data visualization, and exploratory techniques to detect trends.
Analysts may study correlations between variables, compare performance across different regions, or track changes over time.
Step 4: Insight Generation
The purpose of analysis is to answer real business questions.
For example, analysts may discover which product category generates the most revenue, which marketing campaign produces the highest conversion rate, or why sales declined during a specific period.
These discoveries become insights that guide decision making.
Step 5: Decision Making
The final stage involves applying insights to business strategy.
Companies may launch new marketing campaigns, adjust pricing strategies, improve products, or target specific customer segments based on the insights generated.
This ability to transform data into actionable decisions is what makes Data Analytics valuable.
What Does a Data Analyst Actually Do?
Many beginners assume Data Analysts only work with spreadsheets. In reality, their responsibilities are much broader.
Daily Responsibilities of a Data Analyst
A typical Data Analyst performs several tasks during the analytics process.
They collect data from various systems and ensure it is properly organized.
They write queries to extract specific information from databases.
They analyze datasets to identify patterns and trends.
They create visualizations and dashboards that help stakeholders understand the results.
They present insights and recommendations to business teams or decision makers.
At Neody IT, we emphasize that Data Analysts combine technical knowledge with business understanding. Their goal is not just to analyze data but to translate insights into meaningful business strategies.
Tools Used by Data Analysts
To perform their work effectively, Data Analysts use a variety of tools and technologies.
Excel is often used for basic data analysis and reporting.
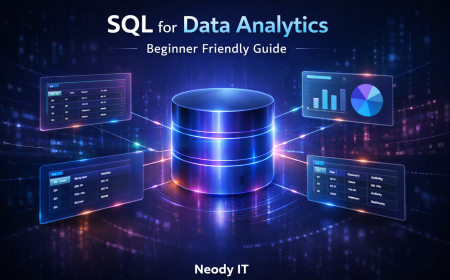
SQL is essential for retrieving data from databases.
Python is widely used for data analysis and automation.
Power BI and Tableau are popular tools for creating interactive dashboards and visualizations.
Google Sheets is frequently used for collaborative data analysis.
These tools allow analysts to explore data, visualize trends, and communicate insights effectively.
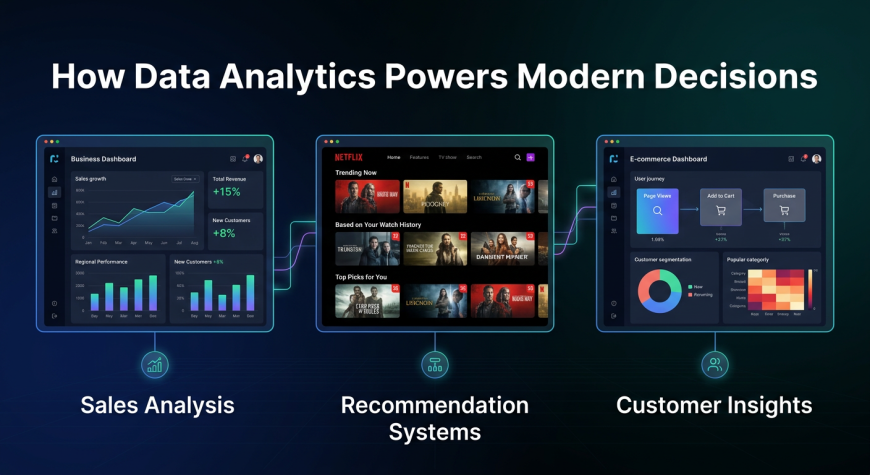
Real World Examples of Data Analytics
Understanding practical applications makes Data Analytics easier to grasp.
Business Sales Analysis
Retail companies analyze sales data to identify which products perform best, which seasons generate the highest demand, and which regions contribute the most revenue.
These insights help businesses plan inventory, optimize pricing, and design effective marketing campaigns.
Streaming Platform Recommendations
Streaming platforms analyze viewing patterns to understand user preferences.
They track watch history, preferred genres, and viewing time.
Using this data, they recommend personalized content to each user, improving engagement and customer satisfaction.
Customer Behavior Analysis
E‑commerce companies analyze browsing behavior, purchase patterns, and abandoned carts.
These insights help companies design targeted marketing campaigns, recommend products, and improve the overall customer experience.
Types of Data Analytics
Data Analytics can be categorized into four main types.
Descriptive Analytics
Descriptive analytics explains what happened in the past.
For example, a monthly sales report that shows revenue trends is a descriptive analysis.
Diagnostic Analytics
Diagnostic analytics investigates why something happened.
For example, analysts may examine why sales dropped during a particular month by analyzing marketing performance or customer behavior.
Predictive Analytics
Predictive analytics uses historical data to forecast future outcomes.
Companies may predict future demand for products or estimate customer churn rates.
Prescriptive Analytics
Prescriptive analytics suggests actions based on predictive insights.
For example, a company may determine the best pricing strategy or marketing campaign to maximize revenue.
Skills Required to Become a Data Analyst
Anyone interested in Data Analytics should focus on developing both technical and analytical skills.
Technical Skills
Key technical skills include Excel, SQL, Python, data visualization tools, and basic statistics.
These tools help analysts explore data and generate insights efficiently.
Analytical Skills
Analysts must think logically and solve problems effectively. Pattern recognition and critical thinking are essential.
Communication Skills
Data Analysts must communicate insights clearly to business teams who may not have technical backgrounds. The ability to explain findings in simple terms is extremely valuable.
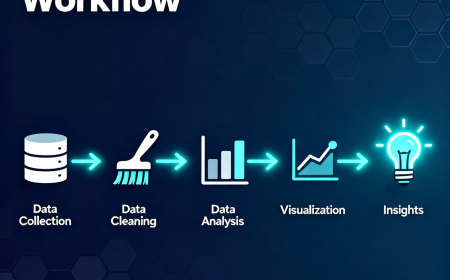
Understanding the Data to Insights Workflow
A simple way to visualize the analytics process is through a workflow diagram.
Data sources provide raw information.
Data cleaning prepares the dataset.
Data analysis identifies patterns.
Insights reveal meaningful findings.
Business decisions apply those insights to real strategies.
This structured workflow shows how raw information gradually transforms into actionable intelligence.
Beginner Reading Path for Learning Data Analytics
If you want to start learning Data Analytics, follow a structured learning path.
Begin with statistics fundamentals and Excel based data analysis.
Then learn SQL to query and extract data from databases.
Next, explore Python for advanced analysis and automation.
Finally, develop skills in data visualization tools and work on real world analytics projects.
At Neody IT, we encourage beginners to focus on building practical skills through projects rather than relying only on theoretical learning.
Career Opportunities in Data Analytics
Data Analytics offers diverse career paths across multiple industries.
Common roles include Data Analyst, Business Analyst, Product Analyst, and Marketing Analyst.
With additional experience and technical knowledge, professionals may transition into advanced roles such as Data Scientist or Machine Learning Engineer.
Because organizations increasingly rely on data driven decision making, the demand for skilled analysts continues to grow.
Final Takeaway
Data Analytics is the process of transforming raw data into meaningful insights that guide business decisions.
The core idea can be summarized simply.
Data leads to Analysis
Analysis produces Insights
Insights drive Decisions
Organizations that understand and use data effectively gain a strong competitive advantage.
For beginners interested in technology, analytics, or data driven problem solving, Data Analytics provides an excellent starting point for careers in data science, artificial intelligence, and business intelligence.
At Neody IT, we believe learning Data Analytics begins with understanding the fundamentals and gradually building practical experience.
If you want to build a career in data, start by mastering the basics, work on real datasets, and continuously improve your analytical thinking skills.
Stay connected with Neody IT for structured learning guides, beginner friendly roadmaps, and practical insights into the world of data and artificial intelligence.
What's Your Reaction?
 Like
19
Like
19
 Dislike
0
Dislike
0
 Love
5
Love
5
 Funny
0
Funny
0
 Angry
0
Angry
0
 Sad
1
Sad
1
 Wow
4
Wow
4


-
 Zack GuptaHii
 -
Kaveri ThakurBest resource for basic data analystics understanding