


SQL Aggregations for Data Analysis Beginner Guide
Learn SQL aggregation functions like COUNT, SUM, AVG, and GROUP BY to analyze data and generate insights. Beginner friendly SQL guide by Neody IT for aspiring data analysts.
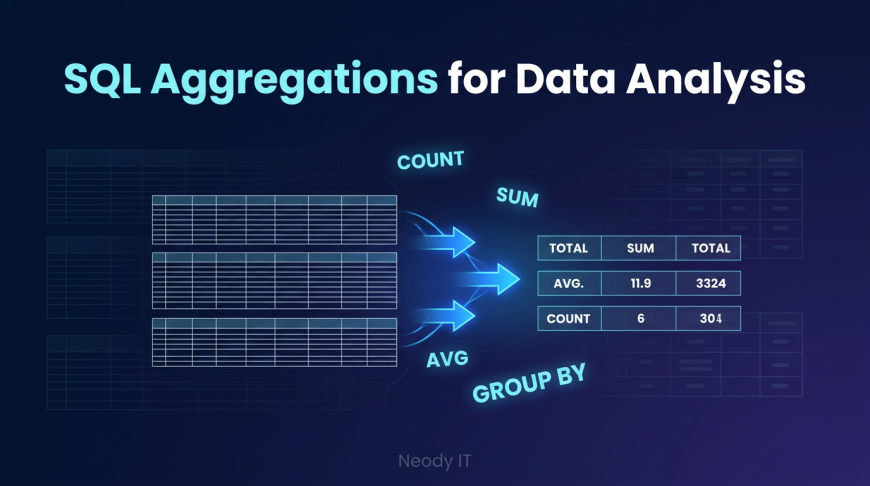
SQL Aggregations for Data Analysis: Complete Beginner Guide
Introduction: Why SQL Aggregations Matter in Data Analysis
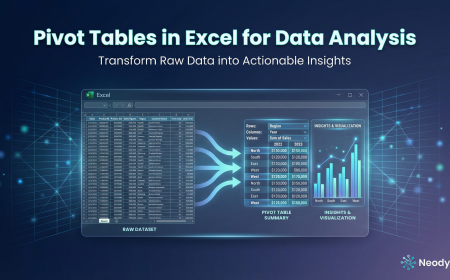
In today’s data driven world, businesses collect massive amounts of raw data every second. From customer transactions to website activity, data is everywhere. But here’s the reality most beginners don’t realize early on: raw data alone is useless unless you can extract meaningful insights from it.
Imagine opening a database with thousands of sales records. You see rows filled with numbers, product names, cities, and dates. At first glance, it looks overwhelming. What businesses actually need is not raw rows, but answers like total sales, average order value, and number of customers.
This is where SQL aggregations become powerful.
SQL aggregation functions help transform raw data into useful summaries. Instead of manually analyzing thousands of rows, you can write a simple query and instantly get meaningful results.
At Neody IT, we always emphasize that aggregation is one of the first real steps where data starts becoming valuable. If you understand SQL aggregations, you move from just looking at data to actually analyzing it.
What Are SQL Aggregation Functions?
Simple Definition
SQL aggregation functions are used to summarize multiple rows of data into a single meaningful value.
Instead of viewing every individual record, these functions combine data to give you insights like totals, averages, and counts.
Why They Are Important
Aggregation functions are essential in real world data analysis because they:
-
Help create reports and dashboards
-
Save time compared to manual calculations
-
Simplify large datasets
-
Enable quick decision making
For example, instead of checking every sales record, businesses want answers like:
-
Total revenue generated
-
Average product price
-
Number of orders placed
These insights are only possible through aggregation.
Understanding Basic SQL Aggregation Functions
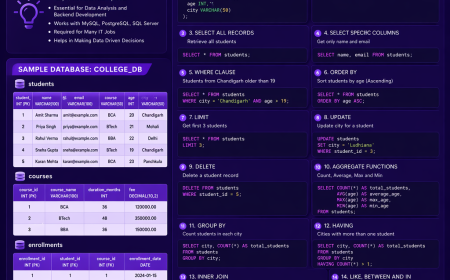
This is the foundation of SQL data analysis. Let’s break down the most important functions every beginner must know.
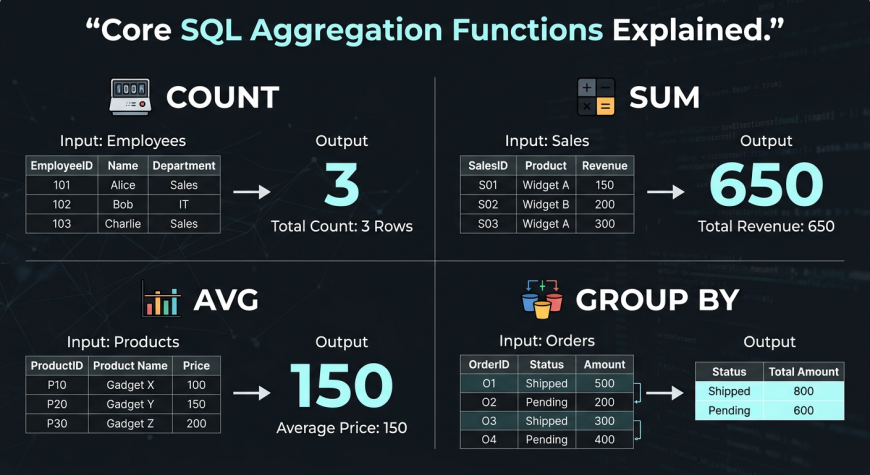
COUNT Function
What it does
The COUNT function calculates the total number of rows or records in a dataset.
Example use cases
-
Total number of customers
-
Total number of orders
-
Number of transactions
Example query
SELECT COUNT(*) FROM sales;
Explanation
This query counts all rows in the sales table.
COUNT is especially useful when you want to measure activity, such as how many users signed up or how many orders were placed.
SUM Function
What it does
The SUM function adds numeric values together.
Example use cases
-
Total sales revenue
-
Total quantity sold
-
Total profit
Example query
SELECT SUM(revenue) FROM sales;Explanation
This query calculates the total revenue from all sales records.
SUM is one of the most commonly used functions in business analytics, especially for financial reporting.
AVG Function
What it does
The AVG function calculates the average value of a dataset.
Example use cases
-
Average order value
-
Average product price
-
Average customer spending
Example query
SELECT AVG(price) FROM products;Explanation
This query calculates the average price of all products.
AVG helps businesses understand trends and patterns, especially in customer behavior and pricing strategies.
GROUP BY: The Most Important Concept
If aggregation functions are powerful, then GROUP BY is what unlocks their true potential.
What is GROUP BY
GROUP BY is used to group rows that have the same values in a specified column.
In simple terms, it divides data into categories and then applies aggregation functions to each category.
Why GROUP BY is Powerful
GROUP BY allows analysts to move from overall summaries to category based insights.
Without GROUP BY, you can only calculate totals for the entire dataset. With GROUP BY, you can break data into meaningful segments.
This is exactly how business dashboards are built.
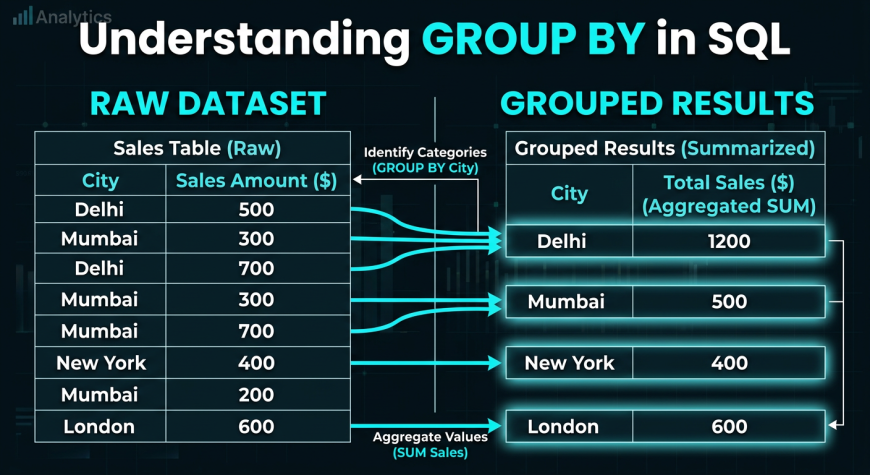
Example: Total Sales by City
SELECT city, SUM(revenue)
FROM sales
GROUP BY city;
Explanation
This query groups sales data by city and calculates total revenue for each city.
Output insight
Instead of one total number, you now get:
-
Revenue for Delhi
-
Revenue for Mumbai
-
Revenue for Bangalore
This is far more useful for decision making.
Real World Examples of SQL Aggregations
To truly understand SQL, you need to see how it applies in real scenarios.
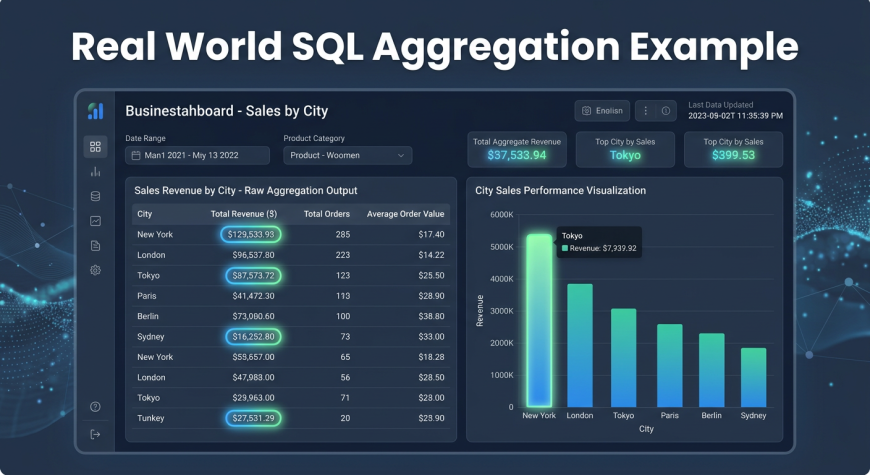
Sales Analysis
Businesses use aggregation to track performance.
-
Total revenue using SUM
-
Total orders using COUNT
-
Average order value using AVG
These metrics help companies measure growth and profitability.
Customer Analysis
Companies analyze customer behavior using aggregation.
-
Total customers
-
Average purchase amount
-
Orders per customer
This helps businesses understand their audience better.
Business Reporting
Aggregation plays a major role in reporting.
-
Revenue by city
-
Sales by product
-
Monthly performance
These insights are used by managers to make strategic decisions.
Combining Aggregations with GROUP BY
This is where SQL becomes truly powerful.
Example 1: Orders per City
SELECT city, COUNT(*)
FROM orders
GROUP BY city;
This shows how many orders come from each city.
Example 2: Average Sales by Product
SELECT product, AVG(price)
FROM sales
GROUP BY product;
This calculates the average price for each product.
Key Insight
GROUP BY combined with aggregation functions allows you to:
-
Break down data into categories
-
Analyze each category separately
-
Generate insights that drive decisions
This combination is the backbone of real world analytics dashboards.
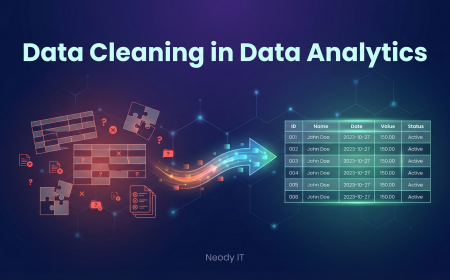
Common Mistakes Beginners Make
When learning SQL aggregations, beginners often make avoidable mistakes.
Common issues
-
Forgetting to use GROUP BY
-
Mixing aggregated and non aggregated columns
-
Using incorrect data types
-
Ignoring NULL values
How to fix them
-
Always include GROUP BY when using non aggregated columns
-
Practice with simple datasets first
-
Ensure numeric columns are used for SUM and AVG
-
Understand how NULL values affect results
At Neody IT, we recommend practicing queries regularly to avoid these mistakes.
Practice SQL Queries for Beginners
Hands on practice is the best way to learn SQL.
Exercise 1: Total Sales
SELECT SUM(revenue) FROM sales;Exercise 2: Count Customers
SELECT COUNT(*) FROM customers;Exercise 3: Average Product Price
SELECT AVG(price) FROM products;Exercise 4: Sales by City
SELECT city, SUM(revenue)
FROM sales
GROUP BY city;
Running these queries will help you understand how aggregation works in real scenarios.
Mini SQL Exercises Section
To build confidence, try solving these problems:
-
Find the city with the highest sales
-
Count the number of products in your dataset
-
Calculate average revenue per region
These exercises simulate real business use cases and help you think like a data analyst.
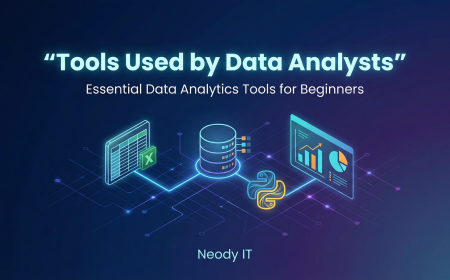
Why SQL Aggregations Are Important for Data Analysts
SQL aggregations are not just a basic concept. They are a core skill required in almost every data role.
They are used in:
-
Business dashboards
-
Reporting systems
-
Data pipelines
-
Analytics tools
Without aggregation, data analysis is incomplete.
If you cannot summarize data, you cannot generate insights.
This is why mastering COUNT, SUM, AVG, and GROUP BY is essential for beginners.
Final Takeaway
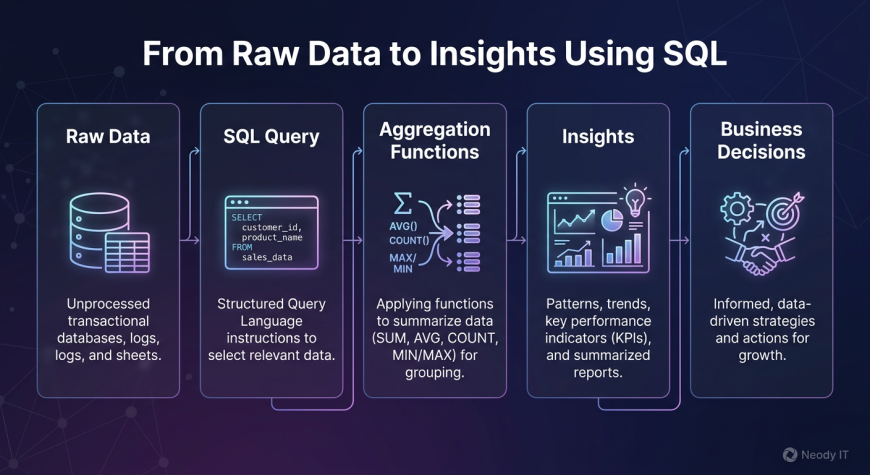
SQL aggregation is the process of transforming raw data into meaningful insights.
Instead of analyzing thousands of rows manually, you can use simple queries to get powerful answers.
A typical workflow looks like this:
Data → SQL Aggregation → Insights → Business Decisions
For beginners starting their journey with Neody IT, mastering SQL aggregations is a major milestone. It is the point where data starts making sense.
Once you understand these concepts, you are ready to move toward more advanced analytics, dashboards, and real world projects.
If you practice consistently, SQL aggregation will become one of your strongest skills in data analysis.
What's Your Reaction?
 Like
1
Like
1
 Dislike
0
Dislike
0
 Love
0
Love
0
 Funny
0
Funny
0
 Angry
0
Angry
0
 Sad
0
Sad
0
 Wow
0
Wow
0