


Important Excel Functions for Data Analysis
Learn the most important Excel functions for data analysis including SUM, AVERAGE, COUNT, and IF. A beginner friendly Excel formula guide by Neody IT for aspiring data analysts.
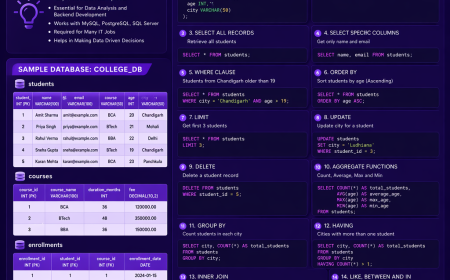
Important Excel Functions for Data Analysis: Beginner Guide
Introduction: Why Excel Functions Are Important in Data Analysis
In the world of data analytics, working with raw data is only the first step. The real value comes from transforming that raw information into insights that help businesses make smarter decisions. This is where Excel functions become extremely powerful.
Microsoft Excel remains one of the most widely used tools in data analysis across industries. From startups to multinational corporations, professionals rely on Excel to organize data, perform calculations, and generate reports. However, manually calculating results in large spreadsheets can quickly become inefficient and error prone.
Excel functions solve this problem by automating calculations. Instead of manually adding hundreds of numbers or counting records one by one, analysts can use built in formulas to perform complex operations instantly.
For example, a business analyst responsible for tracking company sales might have a spreadsheet containing thousands of transactions. Instead of manually calculating total revenue, they can simply apply a SUM function to get the result in seconds.
At Neody IT, we often emphasize that learning Excel functions is one of the first essential steps for anyone entering the field of data analytics. These formulas help analysts analyze datasets faster, reduce human error, and generate insights efficiently.
Understanding a few core Excel functions such as SUM, AVERAGE, COUNT, and IF can dramatically improve the way beginners work with data.
What Are Excel Functions?
Simple Definition
Excel functions are built in formulas designed to perform specific calculations automatically. Instead of writing complex mathematical expressions manually, users can apply predefined functions to analyze data quickly.
These functions can perform many types of operations such as adding numbers, calculating averages, counting records, or applying logical conditions to classify data.
For example, Excel functions can be used to calculate total monthly revenue, determine average customer spending, count the number of sales transactions, or categorize performance levels based on specific rules.
In data analytics workflows, functions play a central role in transforming spreadsheets into meaningful analytical tools. Without these formulas, analysts would spend far more time performing repetitive manual calculations.
Because of their efficiency and reliability, Excel functions are considered fundamental tools for data analysts working with spreadsheets.
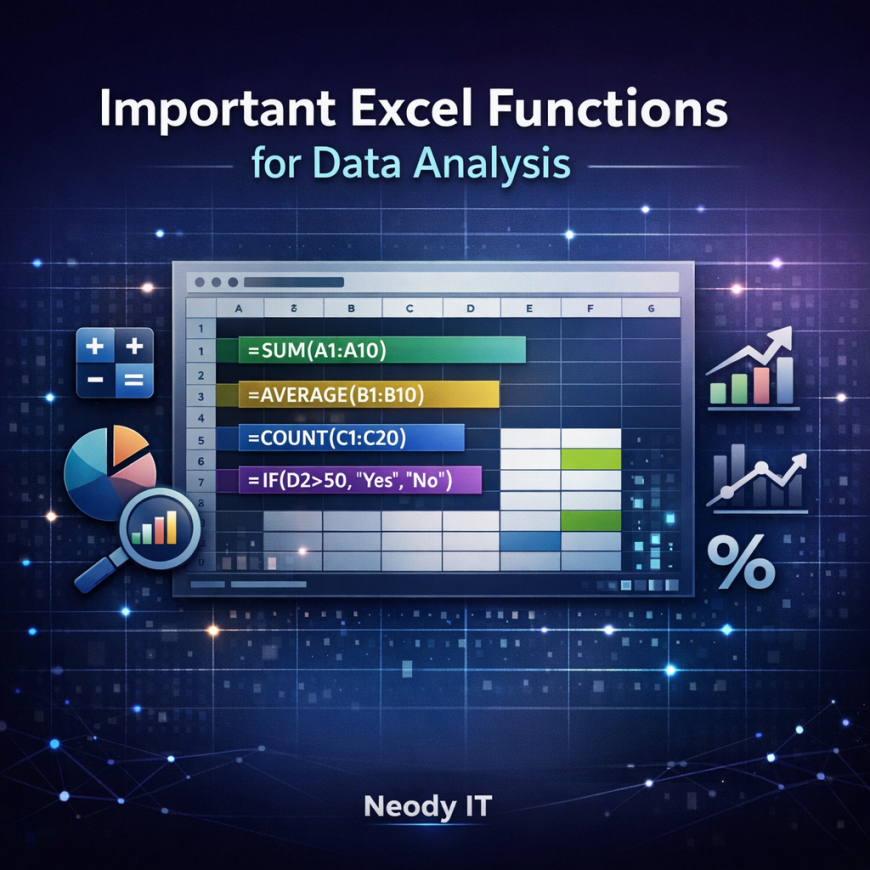
Understanding Excel Formula Structure
Before using Excel functions effectively, it is important to understand how formulas are structured.
Every Excel function follows a specific syntax. A typical formula consists of three key components: the function name, the cell references, and the range of data being analyzed.
A basic formula structure looks like this:
FunctionName(CellRange)
For example:
SUM(A1:A10)
In this formula, SUM is the function name that instructs Excel to add numbers together. The range A1:A10 represents the cells that contain the values to be added.
Excel reads the formula, processes the numbers within the specified range, and then displays the calculated result.
Cell references are extremely important because they tell Excel exactly where the data is located. Instead of typing numbers manually into formulas, analysts reference cells containing the data.
Understanding this structure allows beginners to build formulas that can analyze large datasets efficiently.
SUM Function: Calculate Totals Easily
What SUM Does
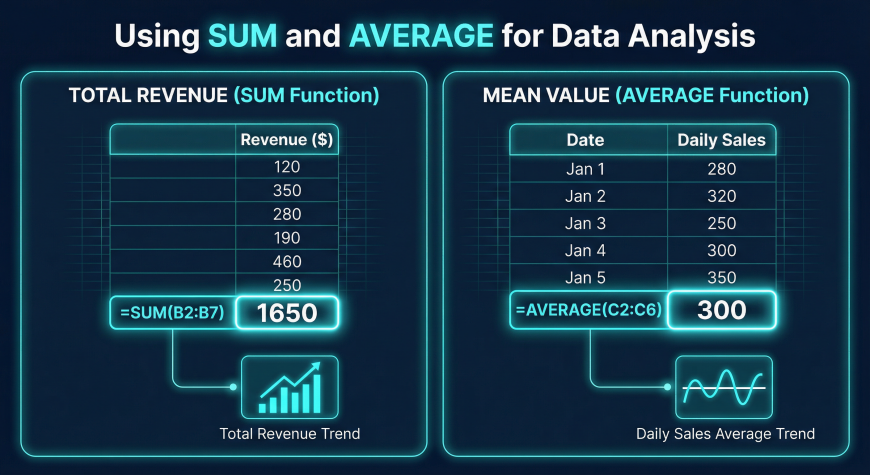
The SUM function is one of the most commonly used formulas in Excel. Its purpose is simple yet extremely powerful. It adds a range of numbers together to produce a total value.
For example, if a spreadsheet contains daily sales numbers for an entire month, the SUM function can calculate the total monthly revenue instantly.
A typical SUM formula might look like this:
SUM(B2:B20)
In this case, Excel adds all the numbers within cells B2 through B20 and returns the total.
Real Data Analysis Example
Imagine a dataset containing product sales information with columns for product name, price, and quantity sold.
A data analyst may want to calculate total revenue generated during a specific period. By multiplying price and quantity for each product and then applying the SUM function, the analyst can determine overall revenue.
Because of its simplicity and usefulness, the SUM function is one of the first formulas every beginner should learn when starting data analysis with Excel.
AVERAGE Function: Understanding Data Trends
What AVERAGE Does
The AVERAGE function calculates the mean value of a dataset. It helps analysts understand typical values within a group of numbers.
The formula structure looks like this:
AVERAGE(C2:C20)
This formula calculates the average value of numbers stored between cells C2 and C20.
In business analytics, average calculations are used frequently to measure key performance metrics.
Examples include calculating average order value, average product price, or average customer spending.
Practical Example
Consider a retail company analyzing customer purchases. The company may want to know how much customers typically spend during each transaction.
By applying the AVERAGE function to the transaction values column, analysts can determine the average purchase amount.
This information helps businesses better understand customer behavior and adjust pricing or marketing strategies accordingly.
COUNT Function: Measuring Dataset Size
What COUNT Does
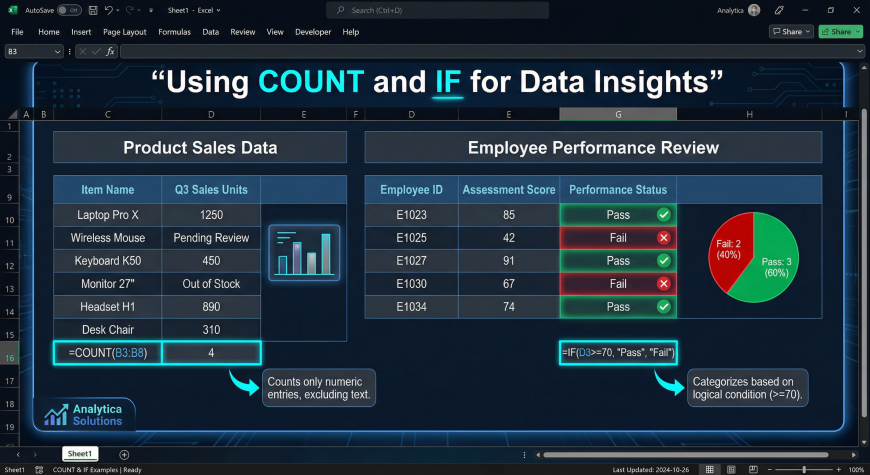
The COUNT function calculates how many numeric values exist within a dataset.
For example:
COUNT(A1:A100)
This formula counts the number of cells within the specified range that contain numeric values.
In data analytics, counting records is often an important step in understanding dataset size and activity levels.
For example, analysts might count how many sales transactions occurred during a specific period or how many entries exist within a dataset column.
Why Analysts Use COUNT
The COUNT function is particularly useful for validating datasets. It helps analysts confirm whether the number of records matches expectations.
For example, if a dataset should contain 500 transactions but COUNT returns only 450, this may indicate missing data.
Using the COUNT function allows analysts to identify potential issues before conducting deeper analysis.
IF Function: Logical Decision Making in Excel
What the IF Function Does
The IF function introduces logical decision making into Excel formulas.
It allows Excel to test a condition and return different results depending on whether the condition is true or false.
The general structure of the IF function is:
IF(condition, value_if_true, value_if_false)
For example:
IF(A2>50,"Pass","Fail")
This formula checks whether the value in cell A2 is greater than 50. If the condition is true, Excel displays "Pass". If the condition is false, it displays "Fail".
Real World Example
Businesses often use the IF function to classify data automatically.
For example, a company analyzing sales performance may classify results as High Performance or Low Performance.
A rule might state that sales above 10,000 represent high performance while values below that threshold represent lower performance.
Using an IF formula, analysts can automatically categorize each sales record without manually reviewing the data.
Real World Examples of Excel Functions
Sales Revenue Calculation
One of the most common applications of Excel functions is calculating sales revenue.
Using the SUM function, analysts can combine revenue from multiple transactions to determine total earnings for a day, week, or month.
This information helps businesses monitor financial performance and track growth trends.
Average Customer Spending
The AVERAGE function can reveal how much customers typically spend during each purchase.
This metric helps companies understand purchasing behavior and adjust pricing strategies to maximize profitability.
Transaction Counting
The COUNT function can determine how many transactions occurred within a dataset. This helps businesses measure activity levels and track sales performance.
Conditional Analysis with IF
The IF function allows analysts to categorize data based on predefined rules.
For example, products may be classified as high demand or low demand depending on sales volume. This classification helps businesses make better inventory decisions.
Excel Formula Cheat Sheet for Beginners
Below is a simple reference table for some of the most important Excel functions used in data analysis.
Function | Purpose
SUM | Adds numbers
AVERAGE | Calculates mean value
COUNT | Counts numeric records
IF | Performs logical conditions
Beginners entering data analytics should become comfortable using these functions because they form the foundation of spreadsheet based analysis.
Excel Practice Dataset for Beginners
The best way to learn Excel functions is by practicing with real datasets.
A simple practice dataset may contain the following columns:
Product
Price
Quantity
Region
Date
With this dataset, beginners can practice applying Excel formulas.
For example, they can calculate total revenue using the SUM function, determine the average product price using AVERAGE, count the number of transactions using COUNT, and categorize products using IF formulas.
Practicing with real data helps learners understand how Excel functions are used in practical business scenarios.
Neody IT encourages beginners to experiment with sample datasets and build simple analytical reports using Excel.
Why Excel Functions Are Important for Data Analysts
Excel functions play a crucial role in the daily workflow of data analysts.
They automate calculations that would otherwise take hours to complete manually. They also help summarize large datasets quickly, allowing analysts to focus on interpreting results instead of performing repetitive tasks.
In addition, Excel functions support data driven decision making by making it easier to generate meaningful metrics from raw data.
Even experienced analysts often rely on Excel formulas for quick analysis before using more advanced tools such as SQL or Python.
For beginners, mastering Excel functions builds a strong analytical foundation that prepares them for more advanced data tools.
Final Takeaway

Excel functions transform simple spreadsheets into powerful analytical tools.
By applying formulas such as SUM, AVERAGE, COUNT, and IF, analysts can convert raw datasets into meaningful insights that guide business decisions.
A typical analytics workflow might look like this:
Dataset → Excel Functions → Analysis → Insights → Decisions
For anyone beginning a career in data analytics, learning these core Excel functions is an essential first step.
At Neody IT, we encourage beginners to practice these formulas regularly using real datasets. Once these foundational skills are mastered, learners can confidently move forward to more advanced analytics tools and techniques.
What's Your Reaction?
 Like
1
Like
1
 Dislike
0
Dislike
0
 Love
2
Love
2
 Funny
0
Funny
0
 Angry
0
Angry
0
 Sad
0
Sad
0
 Wow
0
Wow
0