


Tools Used by Data Analysts: Beginner Guide (2026)
Learn the essential tools used by Data Analysts including Excel, SQL, Python, and Power BI. This beginner guide by Neody IT explains how these tools help analyze data, create dashboards, and generate insights for business decisions.
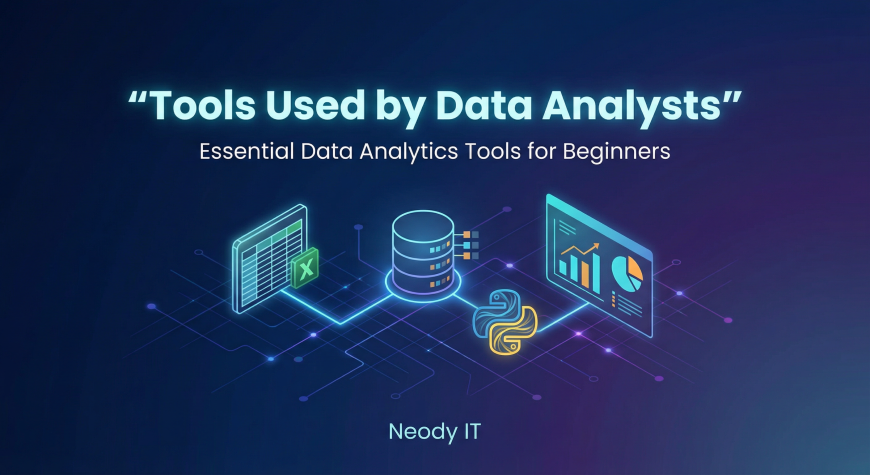
Tools Used by Data Analysts: Beginner Guide to Essential Data Analytics Tools
Data Analytics has become one of the most important fields in modern technology and business. Every organization today relies on data to understand customers, improve products, and make smarter decisions. However, analyzing large amounts of data manually is nearly impossible.
This is where data analytics tools become essential.
A Data Analyst works with thousands or sometimes millions of records. Without proper tools, extracting meaningful insights from that data would take weeks or even months.
At Neody IT, we often explain that learning Data Analytics is not only about understanding concepts. It is also about learning the tools that help transform raw data into actionable insights.
In this beginner guide, you will learn the core tools used by data analysts, why each tool is important, how they fit into the analytics workflow, and how beginners should learn them step by step.
Why Tools Matter in Data Analytics
Data analysts work with large and complex datasets every day. Businesses collect information from websites, mobile applications, transactions, marketing campaigns, and customer interactions.
Without specialized tools, managing and analyzing this information would be extremely difficult.
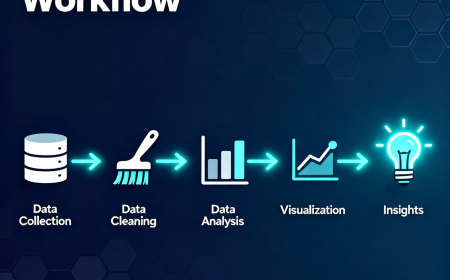
Data analytics tools help analysts perform several important tasks:
Collect and organize datasets
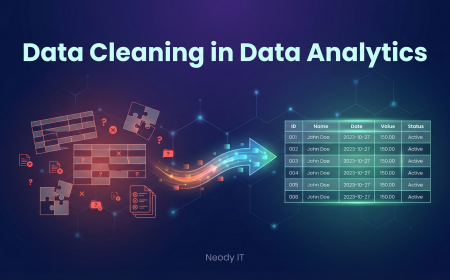
Clean and prepare raw data
Analyze patterns and trends
Create visual reports and dashboards
In simple terms, tools allow analysts to convert raw data into meaningful insights.
For example, imagine a company that records thousands of daily sales transactions. Without tools like Excel or SQL, analyzing that information would require manually reviewing every record. With analytics tools, the same analysis can be completed in minutes.
This is why mastering the right tools is a critical step in becoming a successful Data Analyst.
What Tools Do Data Analysts Use
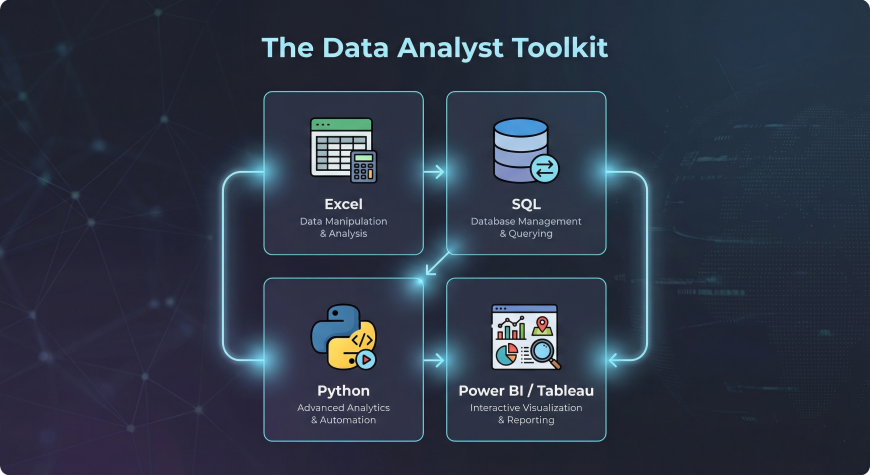
Overview of the Data Analyst Toolkit
Most Data Analysts rely on a combination of tools rather than a single software platform. Each tool serves a different purpose in the analytics workflow.
The most common tools used by data analysts include:
Excel for basic analysis and spreadsheet management
SQL for retrieving and managing data stored in databases
Python for advanced analysis and automation
Power BI or Tableau for data visualization and dashboards
These tools work together to create a complete data analysis process.
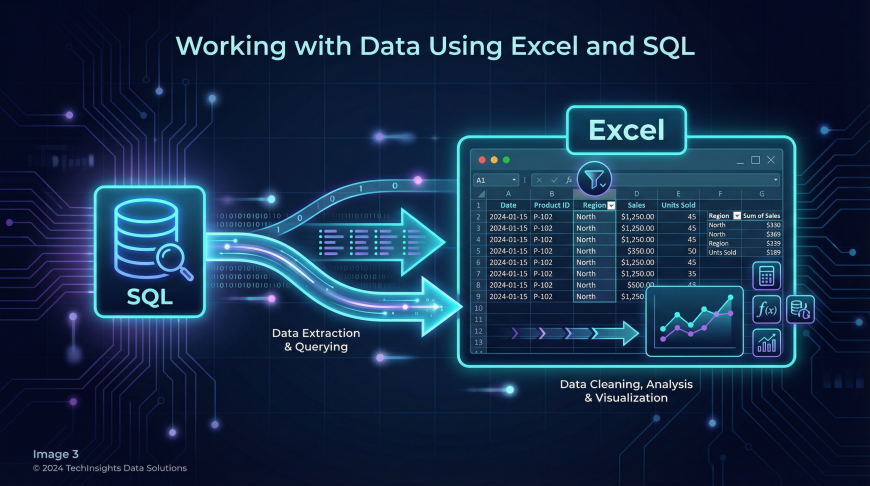
For example, an analyst might use SQL to extract data from a database, Excel to perform quick analysis, Python to run advanced calculations, and Power BI to present results in a dashboard.
At Neody IT, we emphasize that understanding how these tools complement each other is essential for building strong analytics skills.
Excel: The Foundation of Data Analysis
Why Excel Is Important for Data Analysts
Excel remains one of the most widely used tools in Data Analytics, especially for beginners. Many companies rely on spreadsheets for managing business data.
Excel allows analysts to organize datasets, perform calculations, and create charts quickly.
Common uses of Excel in data analytics include:
Organizing and structuring datasets
Performing calculations and statistical operations
Creating charts and graphs
Conducting exploratory data analysis
Because Excel is simple to learn and widely available, it is often the first tool beginners start with.
Key Excel Features for Data Analysis
Excel offers many powerful features that help analysts work efficiently with data.
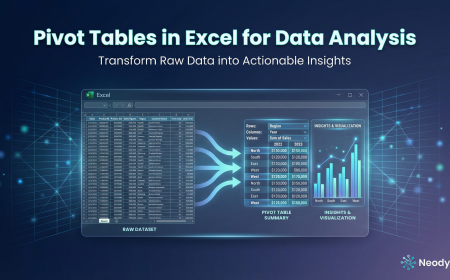
Pivot tables allow analysts to summarize large datasets quickly.
Filtering and sorting tools help identify patterns and trends in data.
Formulas and functions enable calculations such as averages, totals, and percentages.
Conditional formatting highlights important values visually.
Charts and graphs help convert raw numbers into visual insights.
Example Use Case
A retail company may use Excel to analyze monthly sales performance.
By using pivot tables, a sales manager can quickly identify which products generate the highest revenue and which regions perform best.
This type of analysis helps businesses make better inventory and marketing decisions.
SQL: The Language of Databases
Why SQL Is Essential for Data Analysts
While Excel works well for smaller datasets, most companies store their data in databases. Databases allow organizations to manage large volumes of information efficiently.
SQL, or Structured Query Language, is used to interact with these databases.
SQL helps analysts retrieve specific information from large datasets.
Key tasks SQL enables include:
Extracting data from databases
Filtering specific records
Combining multiple tables
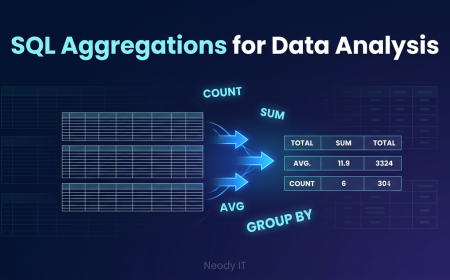
Performing aggregations and calculations
Without SQL, accessing business data stored in databases would be extremely difficult.
Core SQL Concepts Beginners Should Learn
When starting with SQL, beginners should focus on a few essential concepts.
SELECT statements are used to retrieve data from tables.
WHERE clauses filter records based on conditions.
GROUP BY allows analysts to summarize data.
JOIN operations combine data from multiple tables.
ORDER BY sorts results in a specific order.
These concepts form the foundation of database querying.
Example Use Case
A company database may contain millions of purchase records.
An analyst can use SQL to retrieve only the data related to a specific product category or time period.
This filtered dataset can then be analyzed further using other tools.
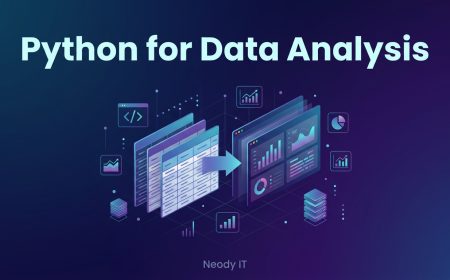
Python: Advanced Data Analysis and Automation

Why Python Is Popular in Data Analytics
Python has become one of the most powerful programming languages for data analysis. Unlike spreadsheets, Python can handle extremely large datasets and perform complex calculations.
Python also allows analysts to automate repetitive tasks.
Benefits of Python in Data Analytics include:
Handling large datasets efficiently
Automating repetitive analysis tasks
Performing advanced statistical analysis
Integrating with machine learning workflows
Because of its flexibility and powerful libraries, Python is widely used in modern data analytics environments.
Important Python Libraries for Data Analysts
Several Python libraries are specifically designed for data analysis.
Pandas is used for data manipulation and analysis.
NumPy provides powerful numerical computing capabilities.
Matplotlib and Seaborn are used for data visualization.
These libraries allow analysts to clean data, perform calculations, and create charts programmatically.
Example Use Case
An analyst working for a financial company may need to analyze millions of transaction records.
Using Python, the analyst can process the dataset, calculate trends, and generate automated reports much faster than using manual tools.
Power BI and Tableau: Data Visualization Tools
Why Visualization Matters
Even the most accurate analysis is useless if decision makers cannot understand it.
Visualization tools help analysts convert complex datasets into clear charts and dashboards.
These visual reports allow business teams to quickly understand patterns and insights.
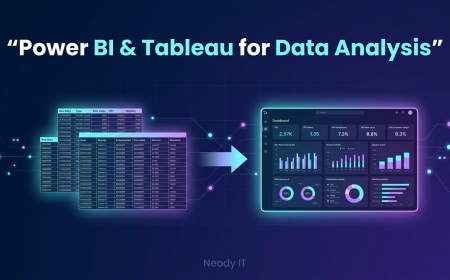
Power BI
Power BI is a business intelligence tool developed by Microsoft.
It allows analysts to connect to multiple data sources and create interactive dashboards.
Power BI integrates well with Excel, databases, and cloud services.
Many organizations use Power BI for business reporting and performance monitoring.
Tableau
Tableau is another widely used visualization platform.
It is known for its powerful interactive dashboards and visual storytelling capabilities.
Tableau allows analysts to create dynamic charts that update automatically when data changes.
Example Use Case
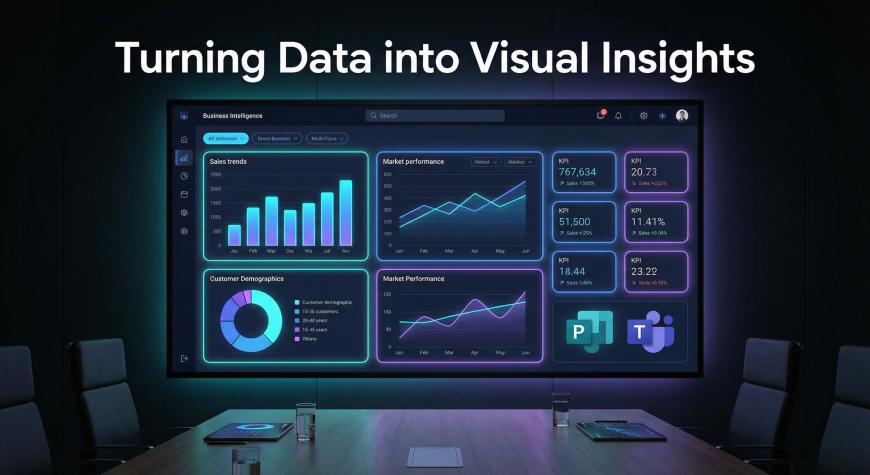
A business dashboard created using Power BI or Tableau might display:
Monthly revenue trends
Customer growth metrics
Product performance comparisons
These dashboards help executives make informed decisions quickly.
Tool Comparison Table
Different tools serve different purposes in the data analytics workflow.
| Tool | Main Purpose | Difficulty | Best For |
|---|---|---|---|
| Excel | Basic analysis | Beginner | Small datasets |
| SQL | Database querying | Beginner to intermediate | Extracting data |
| Python | Advanced analysis | Intermediate | Large datasets |
| Power BI / Tableau | Visualization | Beginner to intermediate | Dashboards |
Each tool complements the others, forming a complete analytics toolkit.
Learning Roadmap for Data Analyst Tools
For beginners, learning tools in the right order is important.
At Neody IT, we recommend the following roadmap.
Step one is learning Excel basics and spreadsheet analysis.
Step two is learning SQL to retrieve and manage database data.
Step three is learning Python for advanced data analysis.
Step four is learning visualization tools like Power BI or Tableau.
This step by step approach helps beginners build skills gradually without feeling overwhelmed.
Recommended Beginner Resources
Learning tools becomes easier when combined with practical practice.
Beginners should explore tutorials for Excel, SQL query practice platforms, Python data analysis courses, and dashboard tutorials for Power BI or Tableau.
Platforms such as Kaggle provide real world datasets that allow learners to practice analysis.
SQL practice websites and project based exercises also help build confidence with real scenarios.
At Neody IT, we strongly encourage learners to practice with real datasets instead of relying only on theoretical learning.
Software Downloads for Data Analyst Tools
Beginners can easily access the tools required for data analytics.
Excel can be installed through Microsoft Office or accessed using Excel Online.
SQL databases such as MySQL or PostgreSQL are widely used for practice.
Python can be installed using Anaconda or the official Python installer.
Visualization tools such as Power BI Desktop and Tableau Public are available for free learning and experimentation.
Installing these tools allows beginners to start practicing immediately.
Final Takeaway
A successful Data Analyst does not rely on a single tool. Instead, analysts combine multiple tools depending on the task they need to perform.
A typical workflow may look like this.
Excel is used for quick data exploration.
SQL is used to retrieve information from databases.
Python is used for deeper analysis and automation.
Power BI or Tableau is used to create dashboards and visual reports.
Mastering these tools creates a strong foundation for building a career in Data Analytics.
At Neody IT, we believe that learning tools combined with real world practice is the best way to develop strong analytical skills.
If you want to become a Data Analyst, start by learning these tools step by step, practice with real datasets, and focus on understanding how data can drive meaningful business decisions.
What's Your Reaction?
 Like
9
Like
9
 Dislike
0
Dislike
0
 Love
1
Love
1
 Funny
0
Funny
0
 Angry
1
Angry
1
 Sad
0
Sad
0
 Wow
4
Wow
4
-
 Prajwal PajaiGave me data