


Python for Data Analysis Beginner Guide
Learn Python for data analysis with this beginner guide. Explore Pandas, NumPy, and Matplotlib to analyze data, build insights, and start your journey with Neody IT.
Python for Data Analysis: Beginner Guide
Introduction: Why Python is Important for Data Analysis
If you ask any modern data analyst what tool they rely on the most, Python will almost always be at the top of the list. The reason is simple. Data today is massive, complex, and constantly growing. Manual analysis using spreadsheets is no longer enough.
Businesses deal with millions of records daily, from customer transactions to website activity. Analyzing this data manually would take days or even weeks. Python changes that completely.
Python is a programming language that helps analysts process, analyze, and visualize data quickly and efficiently. Instead of manually calculating sales figures in Excel, Python can handle millions of rows in seconds and generate insights instantly.
At Neody IT, we always emphasize that learning Python is a turning point in a data analyst’s journey. It moves you from basic analysis to real world, scalable data work.
What is Python in Data Analysis
Simple Definition
Python is a powerful programming language widely used for data analysis, automation, and machine learning. It allows analysts to work with data efficiently and perform complex operations with ease.
Why Python is Popular
Python has become one of the most popular tools in data analytics for several reasons:
-
It is easy to learn, even for beginners
-
It has a large and supportive community
-
It offers powerful libraries for data analysis
-
It is used by companies worldwide
For anyone starting their journey with Neody IT, Python is one of the most valuable and in demand skills you can learn.
Why Data Analysts Use Python
Key Benefits
Python offers several advantages that make it ideal for data analysis:
-
It can handle large datasets easily
-
It automates repetitive tasks
-
It supports advanced data analysis
-
It integrates with multiple tools and platforms
Real World Example
Imagine a company analyzing millions of sales transactions. Doing this in Excel would be slow and error prone. With Python, analysts can process the entire dataset, clean it, and generate insights within minutes.
This efficiency is why Python is widely used in real world data analysis.
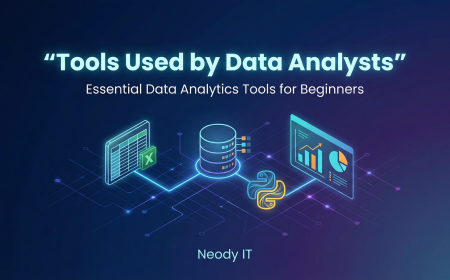
Important Python Libraries for Data Analysis
Python becomes powerful because of its libraries. These libraries are pre built tools that make data analysis easier.
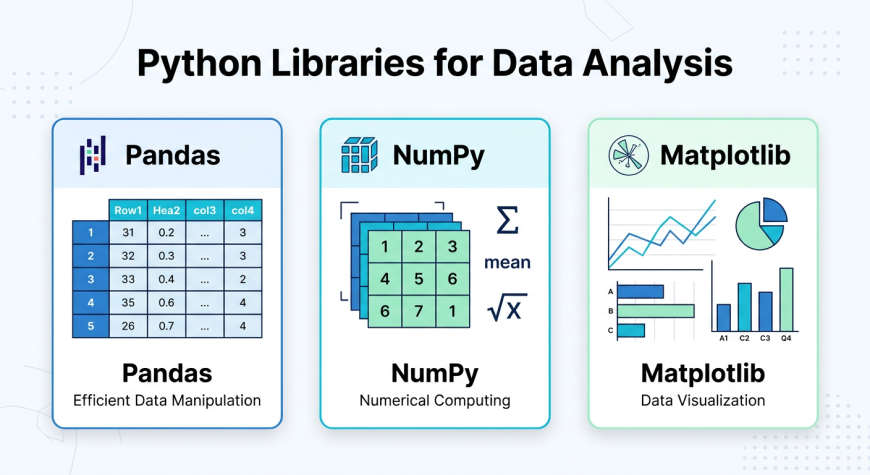
Pandas: Data Manipulation Tool
Pandas is one of the most important libraries for data analysis.
What it does
-
Handles structured data
-
Works with table like data using DataFrames
Key Features
-
Filtering and sorting data
-
Handling missing values
-
Grouping and aggregating data
Example
An analyst can use Pandas to clean and organize a messy sales dataset before analysis.
NumPy: Numerical Computing
NumPy is used for fast mathematical operations.
What it does
-
Performs numerical calculations efficiently
Key Features
-
Supports arrays for fast computation
-
Includes mathematical functions
-
Optimized for performance
Example
Calculating averages, totals, or statistical measures becomes much faster with NumPy.
Matplotlib: Data Visualization
Matplotlib is used for creating charts and graphs.
What it does
-
Converts data into visual insights
Key Features
-
Line charts for trends
-
Bar charts for comparison
-
Histograms for distribution
Example
An analyst can visualize monthly sales trends using a line chart.
Python vs Excel for Data Analysis
Understanding the difference between Python and Excel helps beginners choose the right tool.
Tool | Best For | Limitation
Excel | Small datasets | Slow with large data
Python | Large datasets | Requires coding
Python is more powerful for large scale and automated analysis, while Excel is useful for quick and simple tasks.
Setting Up Python for Data Analysis
Tools Required
To start using Python, you need:
-
Python installed on your system
-
Anaconda or Jupyter Notebook
-
A code editor such as VS Code
Simple Setup Steps
-
Install Python
-
Install libraries like Pandas, NumPy, and Matplotlib
-
Open Jupyter Notebook and start coding
The setup process is simple and beginner friendly, making it easy to get started.
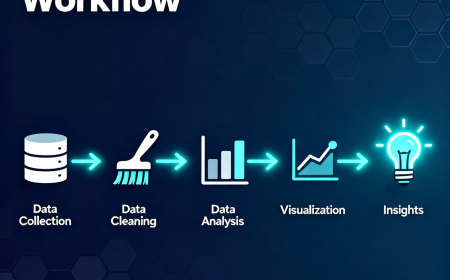
Basic Python Workflow for Data Analysis
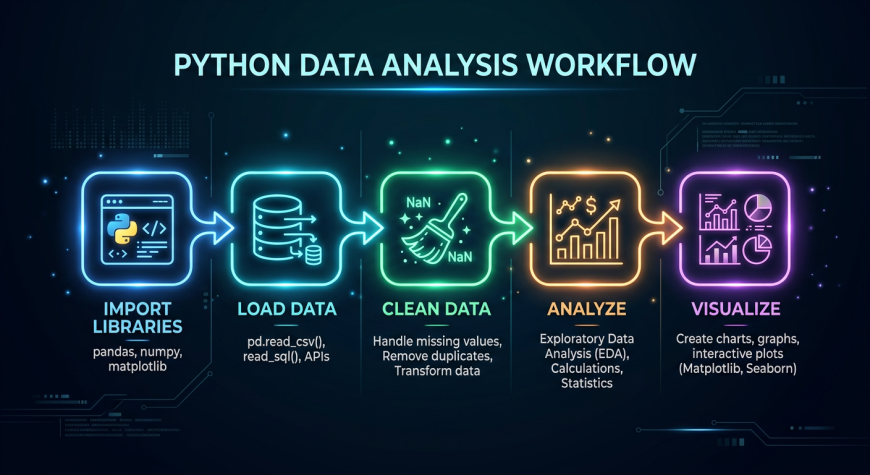
A typical data analysis workflow in Python follows these steps:
Step 1: Import Libraries
Load required libraries such as Pandas, NumPy, and Matplotlib.
Step 2: Load Dataset
Read data from CSV or Excel files.
Step 3: Explore Data
Check the structure of data, view rows and columns, and identify missing values.
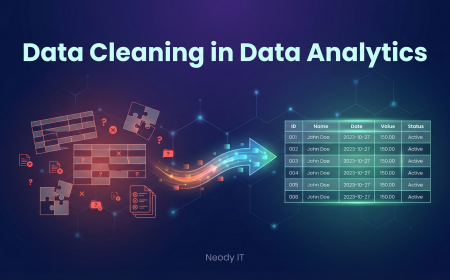
Step 4: Clean Data
Remove duplicates and fix errors.
Step 5: Analyze Data
Perform calculations and identify trends.
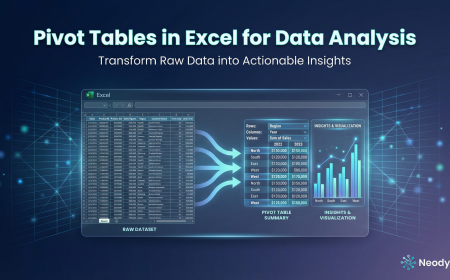
Step 6: Visualize Data
Create charts to present insights.
This structured workflow is followed by most analysts in real world projects.
Real World Use Cases of Python
Python is used across industries for different types of analysis.
Sales Analysis
-
Identify top selling products
-
Analyze revenue trends
Customer Analysis
-
Segment customers
-
Predict customer behavior
Marketing Analysis
-
Evaluate campaign performance
-
Analyze website traffic
At Neody IT, we encourage learners to apply Python to real datasets to understand its practical value.
Beginner Pandas Tutorial
Pandas is often the first library beginners learn.
Basic operations include:
-
Reading datasets
-
Viewing data
-
Filtering rows
-
Selecting specific columns
Example Tasks
-
Calculate total sales
-
Filter high value customers
Practicing these tasks builds a strong foundation in data analysis.
Data Visualization with Matplotlib
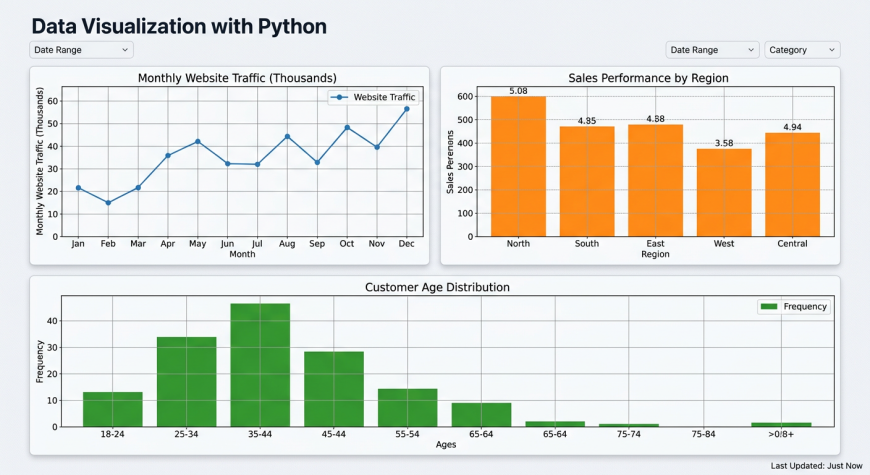
Visualization is a key part of data analysis.
Using Matplotlib, you can:
-
Create line charts to show trends
-
Create bar charts to compare values
Visualizations help turn complex data into easy to understand insights.
Practice Resources for Beginners
To improve your Python skills, focus on consistent practice.
Learning Resources
-
Beginner Python tutorials
-
Pandas documentation
Practice Datasets
-
Kaggle datasets
-
Sales and customer datasets
Practice Ideas
-
Analyze a sales dataset
-
Create charts
-
Build small projects
Hands on practice is the fastest way to learn Python.
Common Mistakes Beginners Make
Many beginners struggle with Python due to common mistakes:
-
Trying to learn everything at once
-
Ignoring data cleaning
-
Not practicing regularly
-
Being afraid of coding
How to Fix Them
-
Start with basic concepts
-
Practice consistently
-
Work on real datasets
At Neody IT, we recommend focusing on progress, not perfection.
Best Practices for Learning Python
To master Python, follow these best practices:
-
Learn step by step
-
Practice daily
-
Work on real projects
-
Focus on problem solving
Consistency is more important than speed when learning Python.
Why Python is Essential for Data Analysts
Python is no longer optional in data analytics. It is a core skill.
It is used for:
-
Data analysis
-
Automation
-
Machine learning
-
Big data processing
A data analyst who knows Python can handle complex tasks more efficiently and stand out in the job market.
Final Takeaway
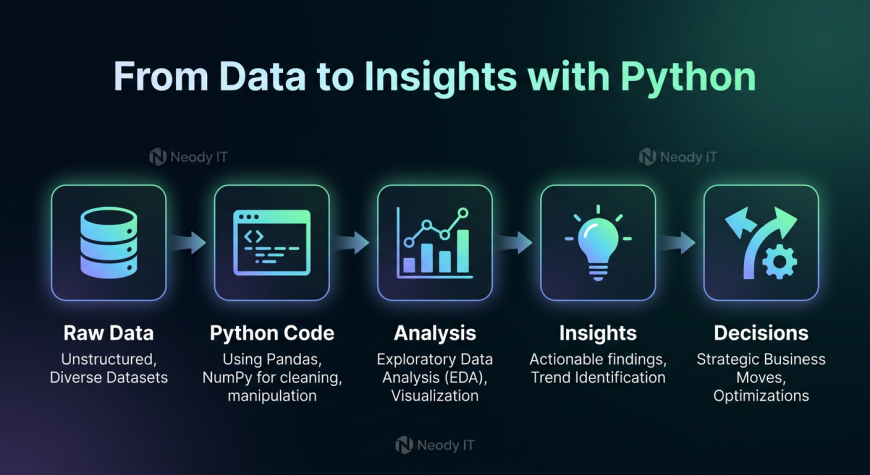
Python is a powerful tool that helps analysts process, analyze, and visualize data efficiently.
Instead of relying on manual methods, Python enables scalable and automated data analysis.
The workflow is simple:
Data → Python → Analysis → Insights → Decisions
For anyone learning with Neody IT, mastering Python is a major step toward becoming a professional data analyst. Start with the basics, practice regularly, and gradually build your skills. That is how real data analysts grow.
What's Your Reaction?
 Like
7
Like
7
 Dislike
0
Dislike
0
 Love
4
Love
4
 Funny
1
Funny
1
 Angry
0
Angry
0
 Sad
0
Sad
0
 Wow
8
Wow
8