


Excel for Data Analysis: Beginner Guide for Analysts
Learn how to use Excel for data analysis with sorting, filtering, formulas, and pivot tables. A beginner friendly Excel guide by Neody IT for aspiring data analysts.

Excel for Data Analysis: A Complete Beginner Guide for Modern Analysts
Introduction: Why Excel is Still Important for Data Analysis
In the world of data analytics, many beginners immediately think about tools like Python, SQL, or Power BI. While those tools are extremely powerful, one of the most widely used data analysis tools in the world is still Microsoft Excel.
Despite the rise of advanced analytics platforms, Excel remains a core tool in business environments. Companies across industries rely on Excel to analyze data, generate reports, track performance, and support decision making.
One reason Excel continues to dominate is its accessibility. Almost every organization already uses Excel, and most professionals have at least basic familiarity with it. This makes Excel an ideal starting point for anyone beginning their journey into data analytics.
At Neody IT, we often recommend beginners start their analytics journey with Excel before moving into more advanced tools. Excel helps learners understand how datasets work, how to organize information, and how to extract insights from structured data.
For example, imagine a sales manager responsible for tracking company performance. Instead of writing code, they can simply open a spreadsheet containing sales transactions and quickly analyze monthly revenue, identify top selling products, and track regional performance.
This ability to turn raw data into insights is exactly why Excel remains one of the most valuable tools for aspiring data analysts.
What is Excel Used for in Data Analysis
Simple Explanation
Excel plays a major role in data analysis because it allows users to organize, explore, and analyze datasets in a structured way.
Data analysts commonly use Excel to perform tasks such as organizing datasets into tables, performing calculations, analyzing trends over time, and creating charts or reports that communicate insights clearly.
When analysts receive raw data from business systems, one of the first tools they often use is Excel. It allows them to quickly inspect the data, identify patterns, and perform preliminary analysis before moving to more advanced tools if necessary.
Why Beginners Should Learn Excel First
For beginners entering the field of data analytics, Excel offers several advantages.
First, it is extremely easy to start using. Unlike programming tools, Excel does not require coding knowledge. Instead, users interact with data through a visual spreadsheet interface.
Second, Excel provides immediate feedback. When a user applies formulas, sorting, or filtering, they can instantly see the results.
Third, Excel is widely used across industries including finance, marketing, operations, and sales. Learning Excel therefore provides practical skills that are directly applicable in real workplaces.
Because of these advantages, many data analysts begin their learning journey with Excel before progressing to SQL, Python, or data visualization tools.
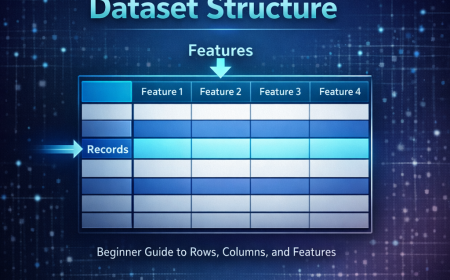
Understanding Excel Dataset Structure
Before performing any analysis, it is important to understand how data is structured inside Excel.
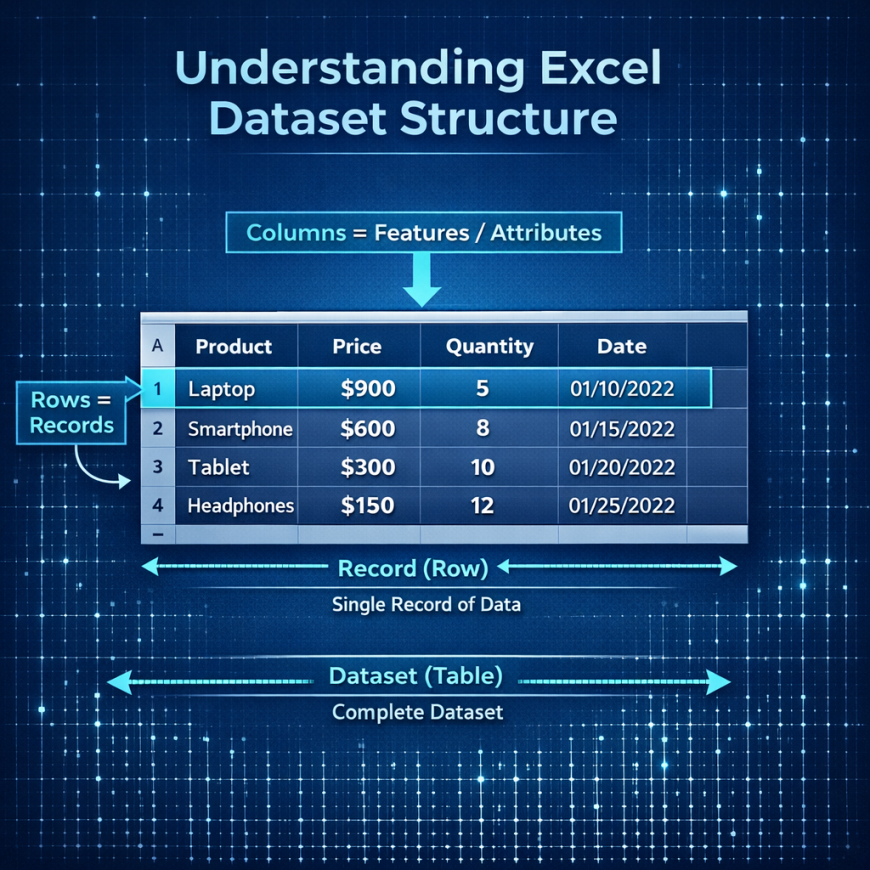
Excel organizes data in a table format made up of rows and columns. This structure is very similar to how datasets are organized in databases, analytics tools, and machine learning systems.
Rows
Rows represent individual records or observations within the dataset.
Each row typically corresponds to a real world event or transaction.
For example, in a sales dataset, each row may represent one sale made by the company. That row could contain information about the product sold, its price, the quantity purchased, and the date of the transaction.
Columns
Columns represent attributes that describe each record. These attributes are often called features in data analytics.
Examples of columns in a typical sales dataset might include product name, price, quantity sold, sales region, and purchase date.
When rows and columns are organized properly, analysts can easily explore patterns and relationships within the data.
Understanding this simple structure is one of the most important foundational concepts in data analytics.
Basic Excel Operations for Data Analysis
Once a dataset is organized properly, analysts can begin exploring it using basic Excel operations. These operations help analysts uncover patterns and insights quickly.
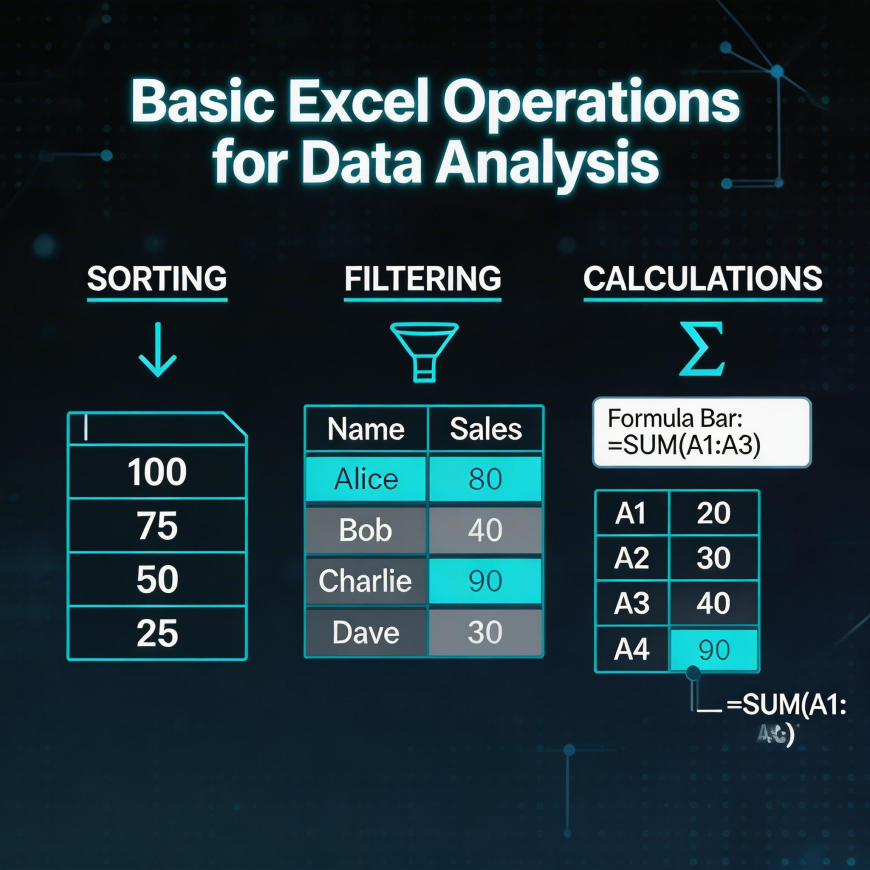
Sorting Data
Sorting is one of the simplest yet most powerful operations in Excel.
Sorting allows analysts to arrange data in a specific order based on the values in a column.
For example, an analyst might sort sales data from highest revenue to lowest revenue in order to identify the top performing products. Another common use case is sorting customer names alphabetically or arranging dates chronologically.
Sorting helps analysts quickly identify trends, patterns, and outliers within large datasets.
Filtering Data
Filtering allows analysts to focus on specific subsets of data without modifying the entire dataset.
For instance, an analyst may filter a dataset to show only sales from a specific region or transactions that occurred during a particular month.
Filtering is extremely useful when working with large datasets because it allows analysts to isolate relevant records and perform targeted analysis.
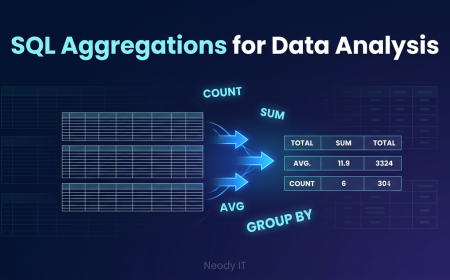
Basic Calculations in Excel
Excel also provides powerful built in formulas that allow analysts to perform calculations easily.
Some of the most commonly used formulas include SUM, which calculates totals across a range of cells, AVERAGE, which computes the average value, COUNT, which counts the number of entries, and MIN or MAX, which identify the smallest and largest values.
For example, a business analyst might use the SUM function to calculate total monthly revenue or use the AVERAGE function to determine the average order value.
These formulas enable analysts to transform raw numbers into meaningful metrics.
Useful Excel Features for Data Analysis
Beyond basic operations, Excel includes several advanced features that significantly enhance data analysis.
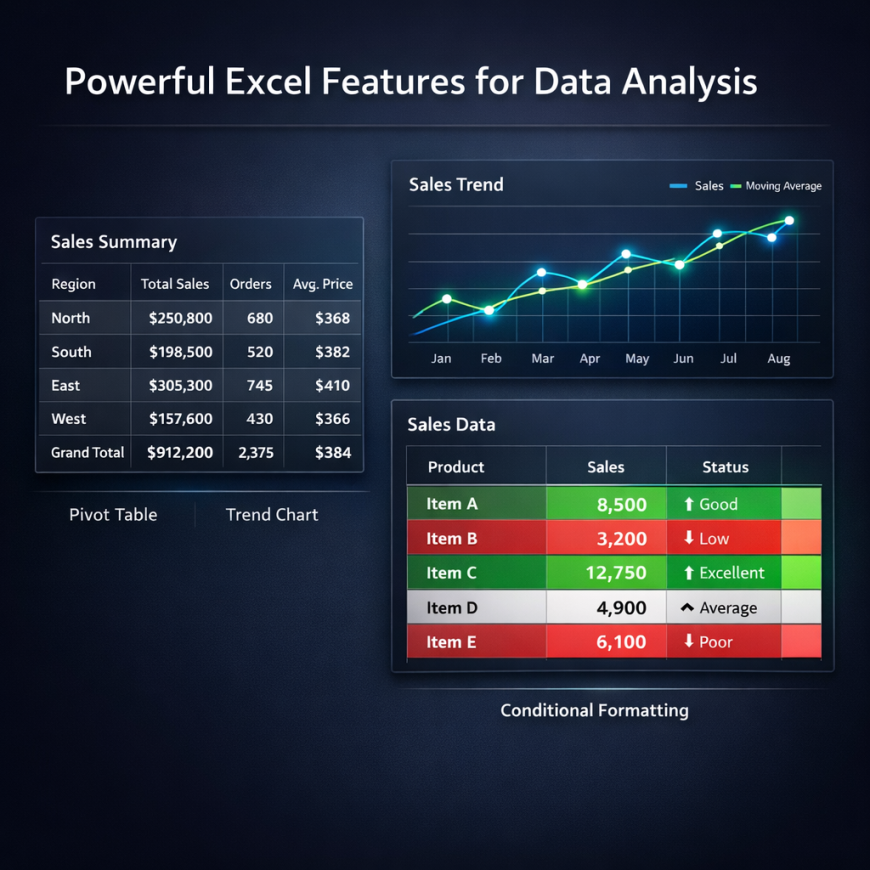
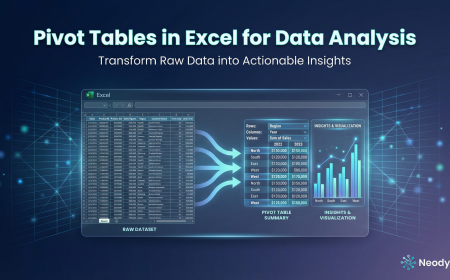
Pivot Tables
Pivot tables are one of the most powerful features in Excel.
They allow analysts to summarize large datasets quickly by grouping and aggregating data.
For example, an analyst can use a pivot table to calculate total sales by product category or compare revenue across different regions.
Pivot tables allow users to explore data dynamically without altering the original dataset, making them extremely useful for exploratory analysis.
Conditional Formatting
Conditional formatting automatically highlights important values in a dataset.
For example, an analyst can configure Excel to highlight the highest sales numbers in green or flag low inventory levels in red.
This visual emphasis makes it easier to detect patterns and anomalies within the data.
Charts and Visualizations
Excel also allows analysts to create visual charts that help communicate insights effectively.
Common chart types include bar charts, line charts, and pie charts.
For example, a line chart might show monthly sales trends across a year, while a bar chart might compare revenue generated by different product categories.
Visualizations are especially valuable when presenting insights to business teams who may not be comfortable interpreting raw numbers.
Real World Examples of Excel in Data Analysis
Excel is used across many industries to analyze business data and guide decisions.
Sales Data Analysis
Companies often use Excel to analyze sales performance. Analysts may calculate total monthly revenue, identify best selling products, and evaluate sales performance across different regions.
These insights help businesses adjust pricing strategies, improve inventory planning, and optimize marketing campaigns.
Customer Data Analysis
Businesses also analyze customer data using Excel.
For example, analysts may examine purchase history to identify repeat customers, calculate average order value, or analyze customer demographics.
These insights help companies design better marketing strategies and improve customer engagement.
Marketing Campaign Analysis
Marketing teams frequently rely on Excel to evaluate campaign performance.
Analysts may track metrics such as conversion rates, website traffic, and advertising spend. By analyzing these metrics, teams can determine which campaigns are most effective and allocate budgets more efficiently.
Excel Shortcuts Every Data Analyst Should Know
Keyboard shortcuts can dramatically improve productivity when working with Excel.
Some of the most useful shortcuts include Ctrl plus Arrow keys, which allow users to navigate quickly through large datasets. Ctrl plus Shift plus L applies filters to a dataset instantly.
Ctrl plus T converts a dataset into a structured Excel table, making analysis easier. Alt plus equals performs an automatic sum calculation for a column of numbers.
Learning these shortcuts saves time and helps analysts work more efficiently when handling large datasets.
Sample Excel Dataset for Practice
Beginners can strengthen their Excel skills by practicing with simple datasets.
A sample dataset might include columns such as product name, price, quantity sold, region, and purchase date.
Using this dataset, beginners can practice sorting products by price, filtering transactions by region, calculating total sales using formulas, and creating charts to visualize trends.
Hands on practice with datasets helps learners understand how Excel supports real world data analysis tasks.
Beginner Excel Learning Resources
To build strong Excel skills, beginners should explore a variety of learning resources.
Many online tutorials teach Excel fundamentals such as formulas, tables, pivot tables, and charts.
Practice platforms such as Kaggle provide free datasets that learners can use to perform analysis.
At Neody IT, we encourage learners to work on practical exercises such as analyzing sales datasets, building pivot tables, and creating simple dashboards.
These activities help transform theoretical knowledge into real analytical skills.
Why Excel is Still Widely Used in Industry
Despite the availability of advanced analytics tools, Excel remains one of the most widely used platforms in business environments.
Almost every company uses Excel in some capacity. It is easy to learn, highly accessible, and capable of handling many types of analytical tasks.
Excel also integrates well with other tools such as SQL databases and Power BI dashboards. Analysts often use Excel as part of a larger data workflow.
Even experienced data professionals continue to rely on Excel for quick analysis, reporting, and exploratory data work.
Final Takeaway
Excel remains one of the most important tools for anyone entering the field of data analytics.
It provides a simple yet powerful environment for organizing datasets, performing calculations, analyzing trends, and generating insights.
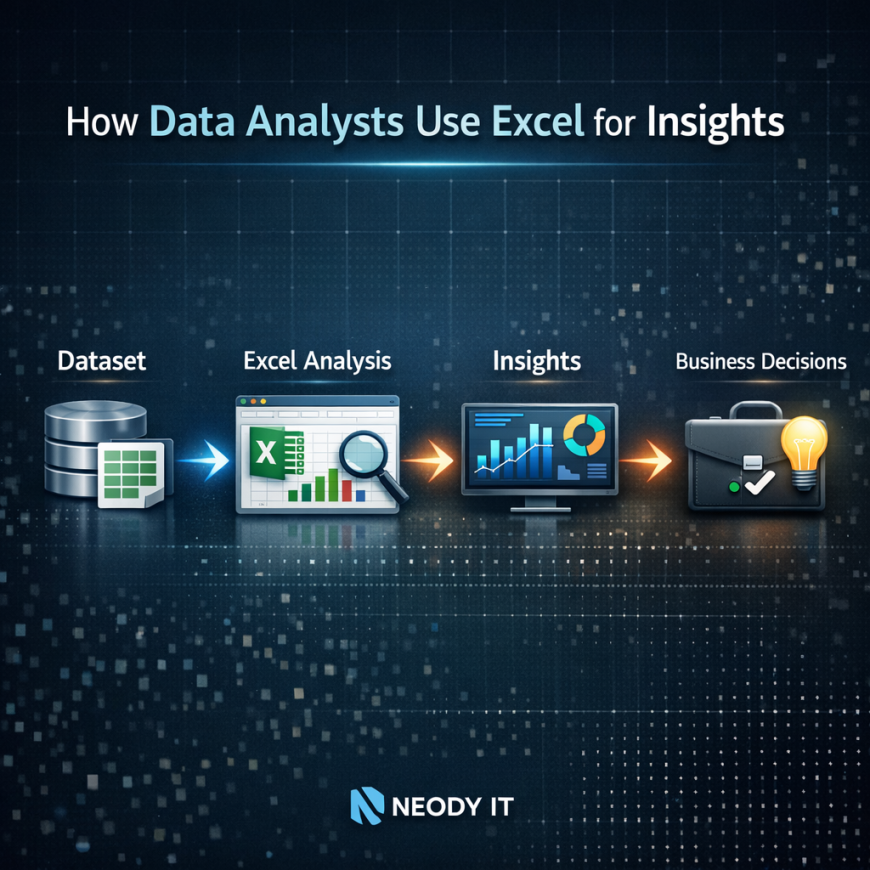
A typical workflow might begin with a dataset, followed by Excel analysis, which produces insights that support business decisions.
By mastering Excel, beginners build a strong analytical foundation that prepares them for advanced tools such as SQL, Python, and data visualization platforms.
For learners starting their analytics journey through Neody IT, Excel is not just a spreadsheet tool. It is the first step toward understanding how data can be transformed into meaningful insights that drive smarter decisions.
What's Your Reaction?
 Like
2
Like
2
 Dislike
0
Dislike
0
 Love
0
Love
0
 Funny
0
Funny
0
 Angry
0
Angry
0
 Sad
0
Sad
0
 Wow
3
Wow
3