


Understanding Dataset Structure: Beginner Guide
Learn how datasets are structured with rows, columns, features, and target variables. This beginner guide by Neody IT explains dataset organization with practical examples for data analytics and machine learning.
Understanding Dataset Structure: A Beginner Guide to Rows, Columns, and Features
In the world of Data Analytics and Machine Learning, datasets are the foundation of every analysis and model. Before a data analyst can extract insights or build predictive models, they must first understand how data is organized.
Many beginners jump directly into tools like Python, SQL, or visualization software without fully understanding how datasets are structured. This often creates confusion when they start working with real data.
At Neody IT, we emphasize that one of the most important skills for beginners is learning how to read and understand a dataset.
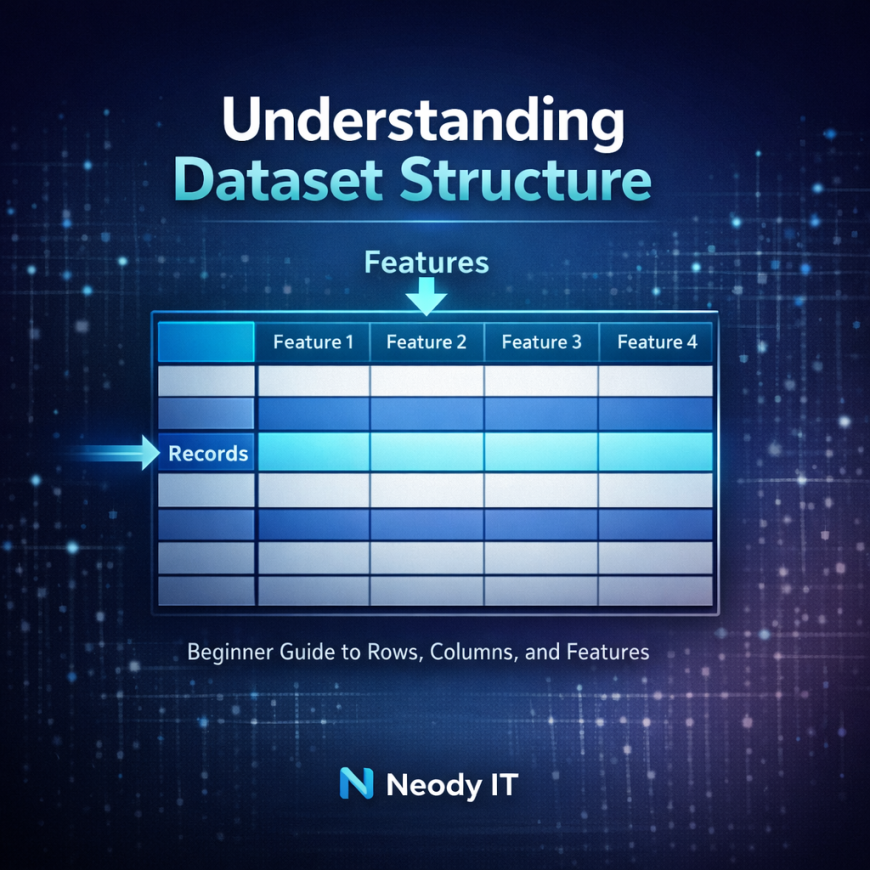
Most datasets follow a simple structure that looks similar to a spreadsheet or database table. In this structure, rows represent individual records, while columns represent the attributes or features that describe those records.
In this guide, we will break down how datasets are organized, explain the meaning of rows and columns, introduce the concept of target variables, and provide practical examples that help beginners understand how analysts work with datasets in real scenarios.
Why Understanding Dataset Structure Matters
Data analysts and machine learning engineers work with datasets every day. Whether analyzing sales trends, predicting customer behavior, or building recommendation systems, the first step always involves understanding the dataset being used.
Before any analysis begins, it is important to understand how the information inside a dataset is organized.
Most datasets follow a table like format similar to spreadsheets in Excel or tables in a database.
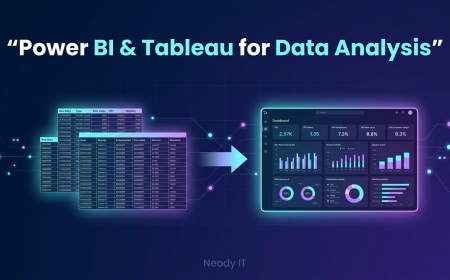
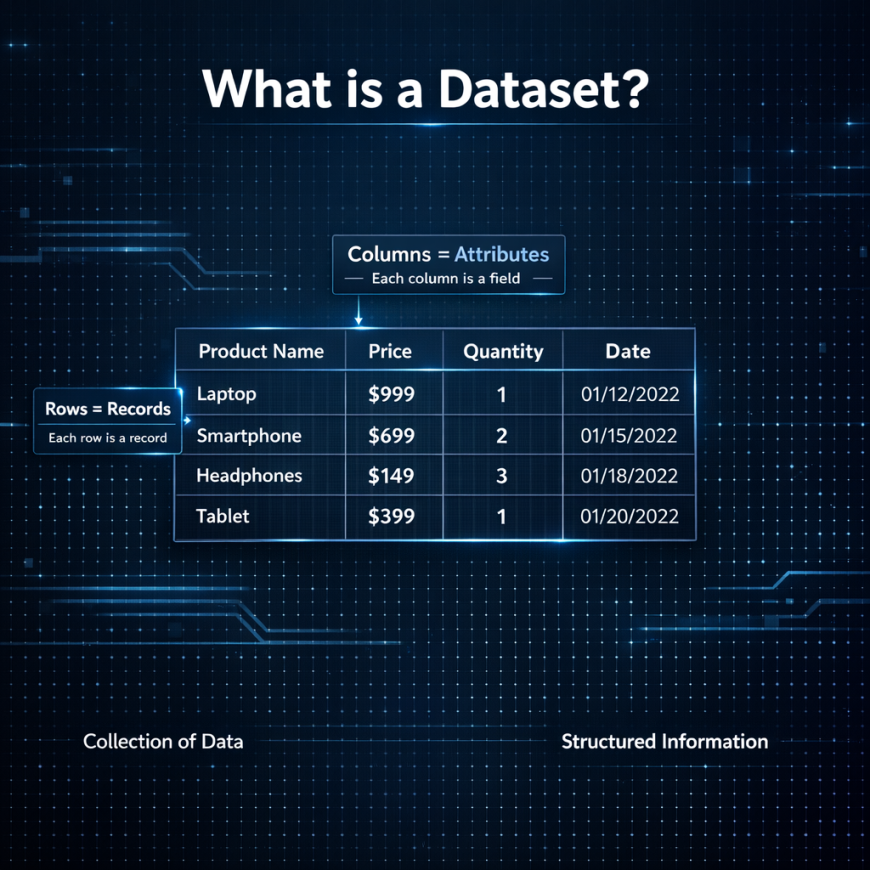
For example, imagine a spreadsheet containing sales information from an online store. Each row in the spreadsheet represents a single transaction, while each column represents details about that transaction, such as product name, price, quantity, or purchase date.
This structure allows analysts to easily filter, analyze, and visualize information.
Understanding this basic structure helps beginners interpret data correctly and prevents mistakes during analysis.
What is a Dataset
Simple Definition
A dataset is a collection of organized data that is used for analysis, reporting, or machine learning tasks.
Datasets store information in a structured format so that analysts and systems can process the data efficiently.
In simple terms, a dataset is a table of information that describes real world events, objects, or observations.
Dataset Example
Consider a dataset used by an e commerce company to track sales. The dataset might include information such as:
Product name
Price
Quantity sold
Date of purchase
Customer location
Each row in the dataset represents a single purchase event. Together, these rows form a complete dataset that analysts can study to understand sales performance.
For example, analysts might use this dataset to identify the most popular products, seasonal demand trends, or regional sales patterns.
Basic Structure of a Dataset
Most datasets are organized using two key components: rows and columns.
Understanding these two elements is essential for anyone entering the field of Data Analytics.
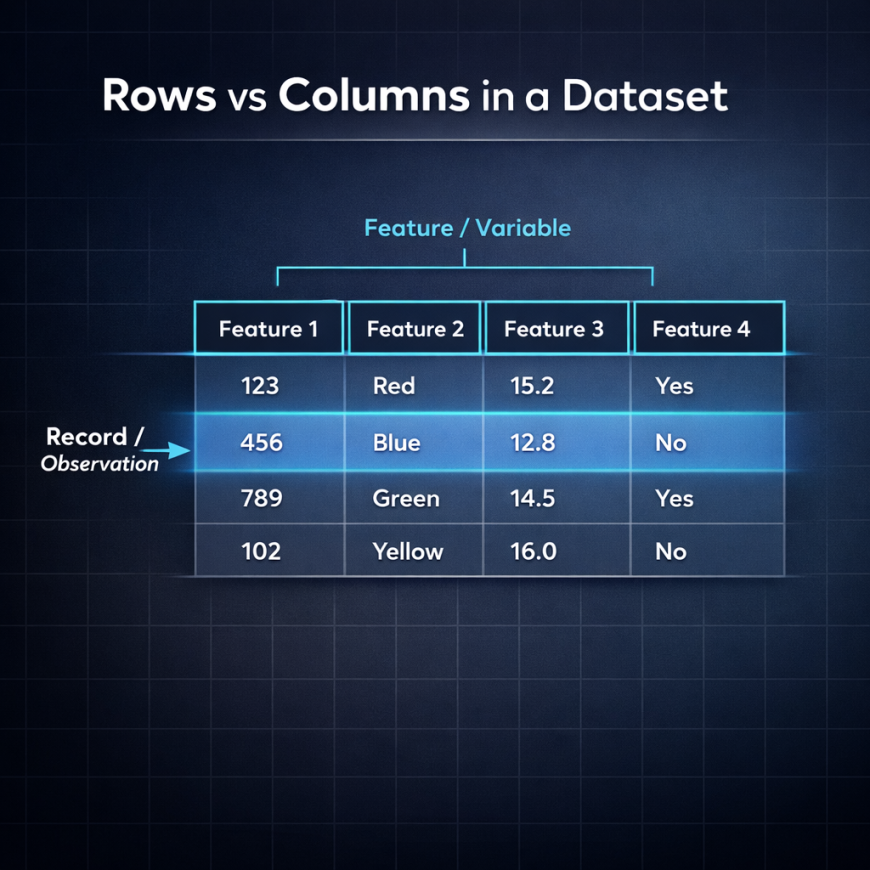
Rows: Records or Observations
Rows represent individual entries or observations within a dataset.
Each row corresponds to a specific event or record.
For example, in a sales dataset:
Row 1 may represent the sale of Product A to Customer X.
Row 2 may represent the sale of Product B to Customer Y.
Row 3 may represent the sale of Product C to Customer Z.
Each row describes a real world event.
Rows are often referred to using different terms depending on the field. In statistics they are called observations. In databases they are called records. In machine learning they are sometimes referred to as data points.
Regardless of the terminology, rows always represent individual instances of data.
Columns: Features or Variables
Columns represent the attributes or properties that describe each row.
Each column contains a specific type of information.
For example, a sales dataset might include the following columns:
Product Name
Price
Quantity
Customer ID
Purchase Date
Each column describes one characteristic of the transaction.
Columns are also known by different names depending on the context. In machine learning they are called features. In statistics they are called variables. In database systems they are often referred to as fields.
These columns provide the descriptive information that analysts use to study patterns in the dataset.
Target Variable: A Key Concept for Machine Learning
For beginners interested in machine learning, another important concept in datasets is the target variable.
What is a Target Variable
The target variable is the value that a machine learning model attempts to predict.
In machine learning tasks, the dataset is divided into two parts: features and the target variable.
Features contain the input information used to train the model.
The target variable represents the output that the model tries to predict.
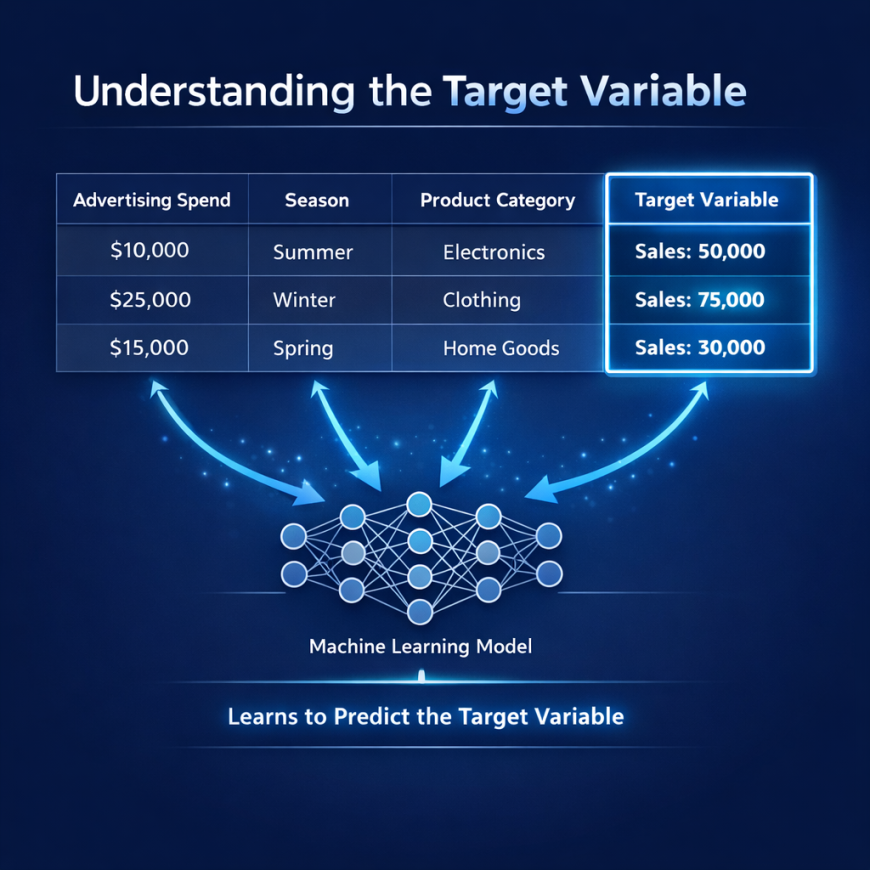
Example of a Target Variable
Consider a dataset used to predict sales revenue.
The dataset might include the following features:
Advertising spend
Season
Product category
Region
The target variable could be total sales.
The machine learning model analyzes the relationship between the features and the target variable in order to make predictions about future sales.
Understanding which column represents the target variable is essential when building predictive models.
Example: Sales Dataset Breakdown
To better understand dataset structure, consider the following simplified example of a sales dataset.
| Product | Price | Quantity | Date | Total Sales |
|---|
Each row in the table represents a single transaction.
The columns describe different attributes of the transaction.
If the goal is to predict revenue, the column labeled Total Sales could be considered the target variable.
Data analysts use this type of dataset to analyze purchasing patterns, identify high performing products, and forecast future demand.
Dataset Structure Visualization
Most datasets follow a tabular format that resembles a spreadsheet.
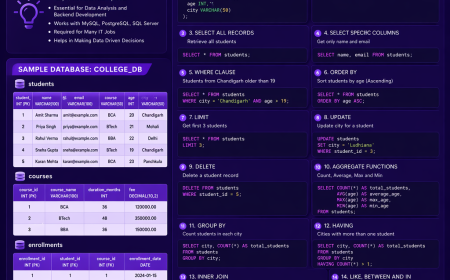
Common dataset formats include Excel files, CSV files, SQL database tables, and DataFrames used in Python.
Excel files often use the .xlsx extension and are widely used for business analysis.
CSV files store data as plain text separated by commas and are one of the most common formats used in data analytics.
SQL tables store structured data in relational databases.
Python libraries such as Pandas represent datasets using DataFrames, which follow the same rows and columns structure.
Tools such as Excel, SQL, and Python are designed to read and manipulate datasets in this tabular format.
Real World Dataset Examples
Understanding dataset structure becomes easier when looking at real world examples.
Sales Dataset
A sales dataset typically contains columns such as product name, price, quantity, region, and date.
Businesses use this dataset to analyze revenue trends and forecast demand.
Customer Dataset
Customer datasets include information such as customer ID, age, location, and purchase history.
Companies use this data to understand customer behavior and design targeted marketing campaigns.
Student Performance Dataset
Educational datasets often include columns such as student name, study hours, attendance, and exam score.
These datasets can be used to analyze academic performance or build predictive models that estimate exam results.
Sample Datasets for Practice
For beginners learning data analytics, practicing with real datasets is extremely valuable.
Several platforms provide free datasets that can be used for analysis projects.
Kaggle Datasets
Kaggle is one of the most popular platforms for learning data science and analytics. It offers thousands of free datasets covering topics such as sales analysis, movie ratings, customer behavior, and healthcare data.
Beginners can download these datasets and practice analyzing them using tools like Excel, SQL, or Python.
Government Open Data
Many governments publish public datasets related to population statistics, economic indicators, transportation systems, and environmental data.
These datasets are freely available and provide excellent opportunities for beginners to explore real world data analysis projects.
Common Dataset File Formats
Datasets are stored in several common formats used across the analytics industry.
CSV files are one of the most widely used formats because they are simple and compatible with most analysis tools.
Excel spreadsheets are frequently used in business environments.
SQL databases store structured data in relational tables.
JSON datasets are often used in web applications and APIs.
Among these formats, CSV files remain the most common format used in data analytics workflows.
How Data Analysts Work With Datasets
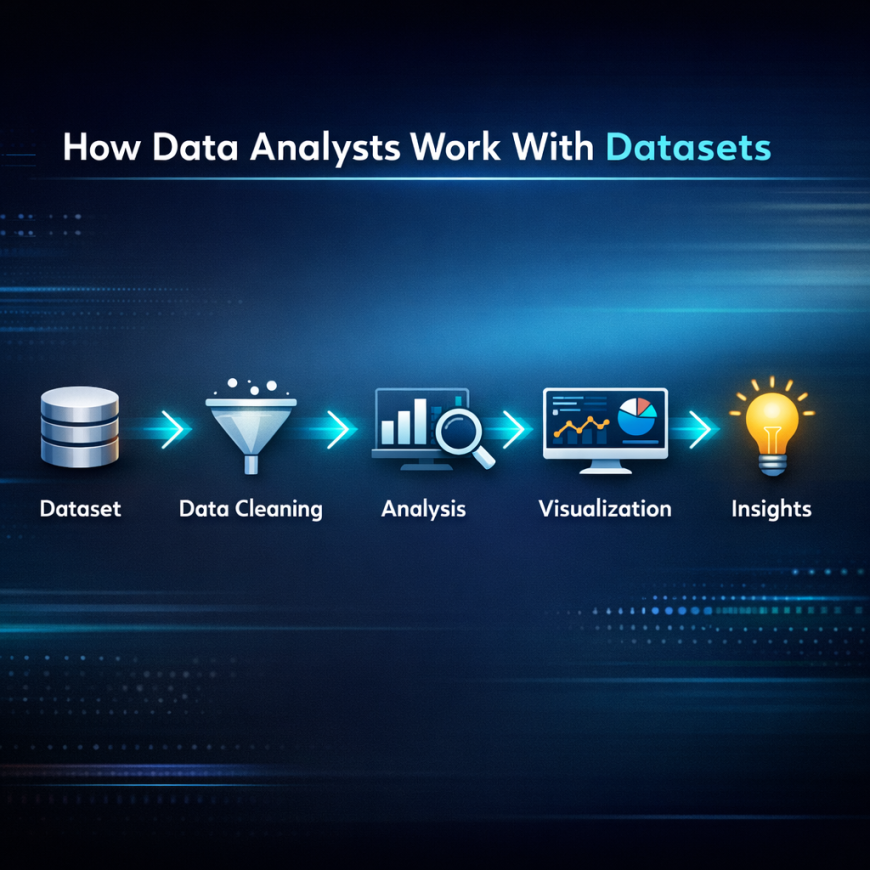
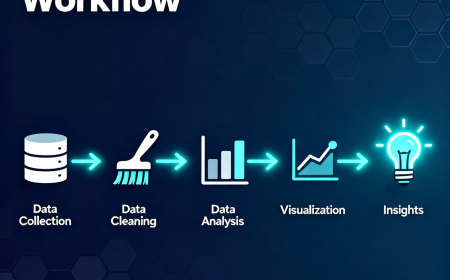
Data analysts typically follow a structured workflow when working with datasets.
First, the dataset is collected from various sources.
Next, the data is cleaned to remove errors, missing values, or duplicates.
After cleaning, analysts explore the dataset to identify patterns and trends.
The results are then visualized using charts or dashboards.
Finally, the insights derived from the analysis help businesses make informed decisions.
Understanding dataset structure makes this entire workflow easier because analysts know exactly how the data is organized.
Final Takeaway
Every dataset follows a simple but powerful structure.
Rows represent individual records.
Columns represent features that describe those records.
The target variable represents the outcome we want to predict in machine learning tasks.
Understanding this structure is one of the first and most important skills for anyone entering Data Analytics, Machine Learning, or Artificial Intelligence.
At Neody IT, we encourage beginners to spend time exploring datasets and understanding how data is organized before diving into advanced analytics tools.
Once you understand dataset structure, analyzing data, building models, and generating insights becomes significantly easier.
Your journey into data starts with understanding how data itself is organized.
What's Your Reaction?
 Like
4
Like
4
 Dislike
0
Dislike
0
 Love
1
Love
1
 Funny
0
Funny
0
 Angry
0
Angry
0
 Sad
0
Sad
0
 Wow
1
Wow
1