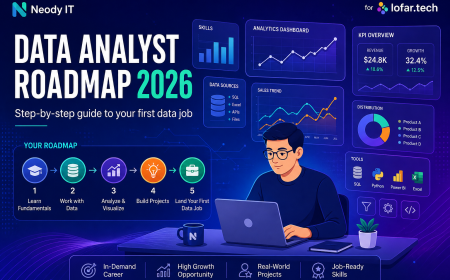


Build a Data Portfolio in One Day Without Experience
Learn how to build a professional data portfolio in one day using free datasets, Python, dashboards, and GitHub projects even with zero experience.


Build a Data Portfolio in One Day Even If You Have Zero Experience
In today’s competitive tech industry, having certifications alone is no longer enough. Recruiters and hiring managers want proof that you can actually work with data, solve problems, and present insights clearly. That is exactly where a strong data portfolio becomes important.
The good news is that you do not need years of experience, expensive bootcamps, or advanced machine learning knowledge to build one.
At Neody IT, we have seen beginners land internships, freelance projects, and interview calls simply by creating well presented portfolio projects using free tools and publicly available datasets.
If you are a student, aspiring data analyst, beginner data scientist, or someone switching careers into tech, this guide will help you create a professional data portfolio in just one day.
By the end of this article, you will know:
-
where to find free datasets
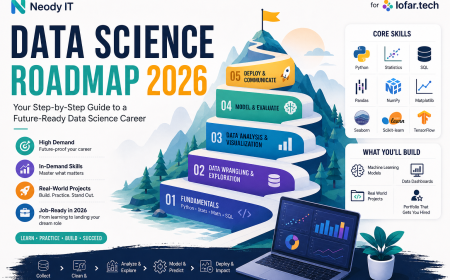
Also Read → Data Science Roadmap 2026: Step-by-Step Guide -
how to analyse data using Python
-
how to build professional dashboards
-
how to present projects on GitHub
-
how to write portfolio case studies recruiters actually read
Let’s begin.
Why a Data Portfolio Matters in 2026
A data portfolio is more than a collection of projects.
It is proof that you can:
-
analyse real world data
-
clean messy datasets
-
create dashboards
-
communicate insights
-
use modern analytics tools
-
solve practical business problems
Most recruiters trust projects more than online certificates because projects demonstrate practical ability.
A beginner with two strong portfolio projects often stands out more than someone with ten certifications but no practical work.
This is especially true for:
-
Data Analyst roles
-
Business Analyst internships
-
Python developer internships
-
Entry level Data Science jobs
-
Freelance analytics projects
At Neody IT, we recommend every beginner build at least 2 to 3 strong projects before applying for internships or jobs.
Step 1: Pick a Free Dataset for Your Portfolio Project
The first step is choosing the right dataset.
Many beginners make the mistake of selecting extremely complicated datasets involving advanced AI or heavy mathematics. That usually leads to frustration and unfinished projects.
Instead, choose something:
-
easy to understand
-
relatable
-
practical
-
visually interesting
-
useful for storytelling
A good beginner project is not about complexity. It is about clarity and presentation.
Best Websites for Free Datasets
Kaggle
Kaggle is one of the best platforms for beginner data analysts and data science students.
Why beginners love Kaggle:
-
over 50,000 free datasets
-
beginner friendly projects
-
active community
-
easy dataset downloads
-
project inspiration from other users
Popular project categories:
-
sports analytics
-
finance
-
healthcare
-
social media trends
-
food delivery apps
-
e commerce
data.gov.in
If you want India specific projects, this platform is gold.
Government datasets often impress recruiters because they involve real world public data.
Examples include:
-
traffic analysis
-
population trends
-
pollution reports
-
healthcare statistics
-
education data
India focused projects also feel more relatable during interviews.
UCI Machine Learning Repository
The UCI Repository contains classic datasets frequently used in:
-
interviews
-
coding assessments
-
analytics practice
-
academic projects
These datasets are excellent for understanding data cleaning and analysis fundamentals.
How to Choose the Right Dataset
A good beginner dataset should:
-
contain clean column names
-
have between 500 and 50,000 rows
-
solve a real world problem
-
contain interesting trends
-
support visual storytelling
Avoid:
-
extremely large datasets
-
highly technical research data
-
datasets with confusing variables
-
projects requiring advanced AI knowledge
Remember, recruiters care more about how clearly you explain your work than how complicated the dataset is.
Step 2: Clean and Analyse the Data Using Python
Once you download your dataset, the next step is data cleaning and analysis.
This is where you transform raw information into meaningful insights.
The best part is that you do not need advanced coding knowledge to start.
Basic Python is enough.
Best Python Libraries for Beginners
Pandas
Used for:
-
reading datasets
-
cleaning data
-
filtering rows
-
grouping data
-
calculations
NumPy
Helpful for:
-
numerical operations
-
arrays
-
calculations
Matplotlib
Used for creating:
-
bar charts
-
line graphs
-
pie charts
Seaborn
Perfect for:
-
professional visualizations
-
heatmaps
-
statistical charts
These libraries are industry standards and widely used by professional analysts.
What You Should Actually Do During Analysis
Clean the Data
Every dataset contains some problems.
Typical cleaning tasks include:
-
removing duplicates
-
handling missing values
-
correcting formatting
-
converting data types
-
renaming confusing columns
Clean data immediately makes your project more professional.
Analyse the Data
Now start finding patterns and trends.
Questions you can explore:
-
Which category performs best?
-
What trends appear over time?
-
Which cities or products generate higher ratings?
-
What factors affect performance?
This is the stage where storytelling begins.
Create Visualizations
Good charts make your portfolio visually attractive and easier to understand.
Useful charts include:
-
bar graphs
-
line charts
-
pie charts
-
heatmaps
-
scatter plots
At Neody IT, we always advise beginners to focus on simple but clean visualizations rather than overly complicated charts.
Step 3: Build a Professional Dashboard
This is the stage that transforms your project from basic to impressive.
A dashboard instantly makes your portfolio look more advanced and industry ready.
Recruiters love dashboards because they demonstrate:
-
visualization skills
-
business thinking
-
reporting ability
-
presentation quality
Best Free Dashboard Tools
Power BI Desktop
Power BI is one of the most widely used business intelligence tools.
Why it is great:
-
free for beginners
-
used by companies worldwide
-
easy drag and drop interface
-
strong visualization capabilities
Tableau Public
Tableau is known for visually attractive dashboards.
Benefits:
-
publish dashboards online
-
easy portfolio sharing
-
professional looking reports
-
beginner friendly interface
Google Looker Studio
This tool is excellent for beginners who want a browser based solution.
Advantages:
-
completely free
-
cloud based
-
easy collaboration
-
quick dashboard creation
What Your Dashboard Should Include
A good dashboard should answer questions visually.
Include:
-
KPI cards
-
trend charts
-
filters
-
top categories
-
comparison graphs
-
summary sections
Do not overload the dashboard with too many visuals.
Simple dashboards often look more professional.
Step 4: Upload Your Project to GitHub
Many students create projects but fail to present them properly online.
That is a major mistake.
Your GitHub profile acts like your digital resume.
Recruiters frequently check:
-
project quality
-
documentation
-
consistency
-
coding habits
-
presentation style
Best Project Structure for GitHub
Organise your project professionally.
Example:
project-name/

data/
notebooks/
dashboard/
images/
README.md
requirements.txt
A clean structure instantly improves readability.
How to Write a README Recruiters Will Actually Read
Your README file is extremely important.
It should quickly explain:
-
what the project is
-
what tools were used
-
what problem was solved
-
what insights were found
Recommended README Structure
Project Title
Example:
IPL 2024 Data Analysis Dashboard
Problem Statement
Explain what you analysed.
Tools Used
Mention:
-
Python
-
Pandas
-
Power BI
-
GitHub
Key Insights
Highlight important findings.
Dashboard Screenshots
Always include visuals.
Conclusion
Summarise the business impact clearly.
At Neody IT, we often notice that projects with strong README files perform significantly better during portfolio reviews.
How to Make Your GitHub Profile Look Professional
A polished profile creates a strong first impression.
Add These Things
-
professional profile picture
-
short bio
-
pinned repositories
-
consistent naming
-
updated projects
Avoid These Mistakes
-
random repository names
-
empty projects
-
unfinished uploads
-
poor documentation
Think of your GitHub profile as your personal tech brand.
Step 5: Write a Simple 3 Line Case Study
Most beginners stop after building the dashboard.
But recruiters want context.
They want to understand:
-
what problem you solved
-
what analysis you performed
-
what insights you discovered
This is why case studies matter.
3 Line Case Study Template
Project Name
Mention the project title.
What You Did
Explain:
-
tools used
-
cleaning process
-
analysis performed
Result or Insight
Mention the key conclusion.
Example Case Study
IPL 2024 Data Analysis
Analysed IPL 2024 match and player performance data using Python and Power BI.
Cleaned datasets, created dashboards, and identified top performing teams and players.
Found that batting strike rate and death over economy significantly influenced match outcomes.
3 Beginner Friendly Data Portfolio Project Ideas
1. IPL 2024 Data Analysis
Why it works:
-
relatable for Indian audiences
-
visually engaging
-
strong storytelling potential
This project is excellent for sports analytics beginners.
2. Zomato Restaurant Ratings Analysis
Why it works:
-
real business use case
-
everyone understands restaurant ratings
-
excellent for visualization practice
You can analyse:
-
ratings by city
-
cuisine popularity
-
pricing trends
-
customer preferences
3. COVID India Dataset Analysis
Why it works:
-
serious and impactful topic
-
demonstrates analytical depth
-
strong visualization opportunities
This project can showcase:
-
trend analysis
-
state wise comparisons
-
growth patterns
-
healthcare insights
Tips to Make Your Data Portfolio Look Advanced
Add Screenshots
Visuals increase engagement and professionalism.
Explain Insights Clearly
Do not just show charts.
Explain what the numbers mean.
Focus on Storytelling
Good analysts explain business impact, not just statistics.
Keep Everything Simple
Simple and clean projects outperform overly complicated projects with poor presentation.
Final Thoughts
Building a data portfolio does not require years of experience.
You do not need:
-
expensive bootcamps
-
advanced machine learning skills
-
professional job experience
You only need:
-
one strong project
-
proper presentation
-
consistency
-
clear storytelling
A well presented portfolio with 2 or 3 quality projects can genuinely help you stand out in today’s competitive tech market.
At Neody IT, we strongly encourage students and beginners to start building projects as early as possible because practical work always creates stronger opportunities than theory alone.
Start today.
By tonight, you could already have a professional data portfolio that looks like months of experience.
If you found this guide helpful, keep following Neody IT for more beginner friendly tech guides, development tutorials, AI resources, and career focused content designed for the next generation of tech professionals.
What's Your Reaction?
 Like
0
Like
0
 Dislike
1
Dislike
1
 Love
0
Love
0
 Funny
0
Funny
0
 Angry
0
Angry
0
 Sad
0
Sad
0
 Wow
0
Wow
0